RSeQC: An RNA-seq Quality Control Package
RSeQC package provides a number of useful modules that can comprehensively evaluate high throughput sequence data especially RNA-seq data. Some basic modules quickly inspect sequence quality, nucleotide composition bias, PCR bias and GC bias, while RNA-seq specific modules evaluate sequencing saturation, mapped reads distribution, coverage uniformity, strand specificity, transcript level RNA integrity etc.
Release history
RSeQC v5.0.4
Oct 3, 2024
Add pyproject.toml file to manage project metadata.
RSeQC v5.0.1
Oct 20, 2022
Fix a bug in
scbam.pyto make it compatible with the latest pysam (v0.19.1).
RSeQC v5.0.0
Oct 16, 2022
add these functions to QC scRNA-seq data. *
sc_bamStat.py*sc_editMatrix.py*sc_seqLogo.py*sc_seqQual.py
RSeQC v4.0.0
Aug. 21, 2020
Add
FPKM-UQ.pyto calcualte HTSeq count, FPKM and FPKM-UQ values defined by TCGAFPKM-UQ.pycould exactly reproduce TCGA FPKM-UQ values, if you use TCGA BAM file (or follow TCGA RNA-seq alignment workflow to generate your own BAM file), the GDC.h38 GENCODE v22 GTF file and the GDC.h38 GENCODE TSV file.
RSeQC v3.0.1
Sep. 21, 2019
Junctions detected from the
junction_annotation.pywill be converted into Interact format file, which can be uploaded into UCSC genome browser for visualization. Example:

RSeQC v3.0.0
Support Python3. Please use previous versions (v2.6.5 or older) if you are using Python2.
add pyBigWig as a dependency package.
RSeQC v2.6.5, v2.6.6
Fix minor bugs.
RSeQC v2.6.4
Two dependency packages bx-python and pysam are not shipped with RSeQC starting from v2.6.4.
Users could install RSeQC using pip: pip install RSeQC. bx-python and pysam will be installed automatically if they haven’t been installed before.
RSeQC v2.6.3
Fix a bug in “read_quality.py” that does not return results if input file containing less than 1000 reads.
Remove “RPKM_count.py” as it generates erroneous results especially for longer reads. Use “FPKM_count.py” instead.
“bam_stat.py” prints summary statistics to STDOUT.
RSeQC v2.6.2
fix bugs in “insertion_profile.py”, “clipping_profile.py”, and “inner_distance.py “
RSeQC v2.6.1
Fix bug in “junction_annotation.py” in that it would report some “novel splice junctions” that don’t exist in the BAM files. This happened when reads were clipped and spliced mapped simultaneously.
Add FPKM.py. FPKM.py will report “raw fragment count”, “FPM” and “FPKM” for each gene. It does not report exon and intron level count.
RSeQC v2.6
Add 3 new modules:
deletion_profile.py
insertion_profile.py
mismatch_profile.py
RSeQC v2.5
read_duplication.py:
add ‘-q’ option filter alignments with low mapping quality.
Fix bug related to the labels of right Y-aixs
bam2fq: add ‘-c’ option to call ‘gzip’ command to compress output fastq file(s).
divide_bam.py: add ‘-s’ option, skipped unmapped reads.
clipping_profile.py:
add ‘-q’ option filter alignments with low mapping quality.
Issue warnning and exit if no clipped reads found.
RSeQC v2.4 rewrite “geneBody_coverage.py”
Memory-efficient: consumed < 100M RAM
Flexible input to handle one or more BAM files
1. Input a singel BAM file. eg: **-i test.bam**
2. Input several BAM files (separated by ","). eg: **-i test1.bam,test2.bam,test3.bam**
3. Input plain text file containing the path of BAM file(s). eg: **-i bam_path.txt**
4. Input a directory containing BAM file(s). eg: **-i my_folder**
Generate heatmap to visualize gene body coverage over many samples.
RSeQC v2.3.9
Add bam2fq.py. Transform BAM files into fastq format.
bugs fixed.
RSeQC v2.3.7
bam_stat.py: Now counts ‘Proper-paired reads map to different chrom’
bam2wig.py: automatically call ‘wigToBigwig’ if it can be found in system $PATH
inner_distance.py: add ‘PE_within_diff_chrom’
RSeQC v2.3.3
Minor bugs fixed.
RSeQC v2.3.2
Add split_bam.py: Split orignal BAM file into small BAM files based on provided gene list. User can use this module to estimate ribosome RNA amount if the input gene list is ribosomal RNA.
Add read_hexamer.py: Calculate hexamer frequency for multiple input files (fasta or fastq).
Some parts were optimized and runs little faster.
RSeQC v2.3.1
Add normalization option to bam2wig.py. With this option, user can normalize different sequencing depth into the same scale when converting BAM into wiggle format.
Add another script. geneBody_coverage2.py. This script uses BigWig? instead of BAM as input, and requires much less memory (~ 200M)
Download
Download RSeQC
Download test datasets
Pair-end strand specific (Illumina).
md5sum=fbd1fb1c153e3d074524ec70e6e21fb9
Pair-end non-strand specific (Illumina).
md5sum=ba014f6b397b8a29c456b744237a12de
Single-end strand specific (SOLiD).
md5sum=b39951a6ba4639ca51983c2f0bf5dfce
Single Cell RNA-seq data:
BAM file generated by cellranger-7.0.1: possorted_genome_bam.bam
md5sum=d0d8d4d58262091ad03386a35806d7dd
Download gene models (update on 12/14/2021)
Note
BED file for other species and the most recent release of these files can be downloaded from UCSC Table Browser
Make sure the gene model and the genome assembly are matched.
Download ribosome RNA (update on 07/08/2015)
We only provide rRNA bed files for human and mouse. We download these ribosome RNAs from UCSC table browser, we provide them here to facilitate users with NO WARRANTY in completeness.
Installation
Use pip3 to install RSeQC (v3.0.0 or newer)
pip3 install RSeQC
or you can simply use “pip install RSeQC” if your pip is a soft link to pip3 (use “pip show pip” to check)
Use pip2 to install RSeQC (v2.6.6 or older)
pip2 install RSeQC
or you can simply use “pip install RSeQC” if your pip is a soft link to pip2 (use “pip show pip” to check)
Input format
RSeQC accepts 4 file formats as input:
BED file is tab separated, 12-column, plain text file to represent gene model. Here is an example.
SAM or BAM files are used to store reads alignments. SAM file is human readable plain text file, while BAM is binary version of SAM, a compact and index-able representation of reads alignments. Here is an example.
Chromosome size file is a two-column, plain text file. Here is an example for human hg19 assembly. Use this script to download chromosome size files of other genomes.
Fasta file.
Note
If you have GFF/GTF format gene files, we found bedopts might be useful to convert them to BED.
Fetch chromsome size file from UCSC
download this script and save as ‘fetchChromSizes’:
# Make sure it's executable
chmod +x fetchChromSizes

fetchChromSizes hg19 >hg19.chrom.sizes

fetchChromSizes danRer7  >zebrafish.chrom.sizes
Usage Information
bam2fq.py
Convert alignments in BAM or SAM format into fastq format.
- Options:
- --version
show program’s version number and exit
- -h, --help
show this help message and exit
- -i INPUT_FILE, --input-file=INPUT_FILE
Alignment file in BAM or SAM format.
- -o OUTPUT_PREFIX, --out-prefix=OUTPUT_PREFIX
Prefix of output fastq files(s).
- -s, --single-end
Specificy ‘-s’ or ‘–single-end’ for single-end sequencing.
- -c, --compress
Specificy ‘-c’ or ‘–compress’ to compress output fastq file(s) using ‘gzip’ command.
Example:
#pair-end
$ python ../scripts/bam2fq.py -i test_PairedEnd_StrandSpecific_hg19.sam  -o bam2fq_out1
Convert BAM/SAM file into fastq format ...  Done
read_1 count: 649507
read_2 count: 350495

#single-end BAM file
$ python ../scripts/bam2fq.py -i test_SingleEnd_StrandSpecific_hg19.bam -s -o bam2fq_out2
Convert BAM/SAM file into fastq format ...  Done
read count: 1000000
bam2wig.py
Convert BAM file into wig/bigWig format.
bam2wig.py converts all types of RNA-seq data from BAM format into wiggle format.
If UCSC wigToBigWig tool was found, output wiggle file will be converted into bigwig format automatically.
BAM file must be sorted and indexed properly using SAMtools. Below example shows how to sort and index BAM file using samTools
# sort and index BAM files
samtools sort -m 1000000000  input.bam input.sorted.bam
samtools index input.sorted.bam
- Options:
- --version
show program’s version number and exit
- -h, --help
show this help message and exit
- -i INPUT_FILE, --input-file=INPUT_FILE
Alignment file in BAM format. BAM file must be sorted and indexed using samTools. .bam and .bai files should be placed in the same directory.
- -s CHROMSIZE, --chromSize=CHROMSIZE
Chromosome size file. Tab or space separated text file with 2 columns: first column is chromosome name/ID, second column is chromosome size. Chromosome names (such as “chr1”) should be consistent between this file and the BAM file.
- -o OUTPUT_PREFIX, --out-prefix=OUTPUT_PREFIX
Prefix of output wiggle files(s). One wiggle file will be generated for non strand-specific data, two wiggle files (“Prefix_Forward.wig” and “Prefix_Reverse.wig”) will be generated for strand-specific RNA-seq data.
- -t TOTAL_WIGSUM, --wigsum=TOTAL_WIGSUM
Specified wigsum. Eg: 1,000,000,000 equals to coverage of 10 million 100nt reads. Ignore this option to disable normalization
- -u, --skip-multi-hits
Skip non-unique hit reads.
- -d STRAND_RULE, --strand=STRAND_RULE
How read(s) were stranded during sequencing. For example: –strand=’1++,1–,2+-,2-+’ means that this is a pair-end, strand-specific RNA-seq data, and the strand rule is: read1 mapped to ‘+’ => parental gene on ‘+’; read1 mapped to ‘-’ => parental gene on ‘-‘; read2 mapped to ‘+’ => parental gene on ‘-’; read2 mapped to ‘-’ => parental gene on ‘+’. If you are not sure about the strand rule, run ‘infer_experiment.py’ default=none (Not a strand specific RNA-seq data).
- -q MAP_QUAL, --mapq=MAP_QUAL
Minimum mapping quality for an alignment to be called “uniquely mapped”. default=30
Example:
$ python2.7 bam2wig.py -s hg19.chrom.sizes -i sample.bam -o out -u

Skip multi-hits:True
No alignments for chr19_gl000208_random. skipped
No alignments for chr21_gl000210_random. skipped
No alignments for chr6_apd_hap1. skipped
Processing chr13 ...
Processing chr12 ...
Processing chr11 ...
Processing chr10 ...
Processing chr17 ...
Processing chr16 ...
Processing chr15 ...
Processing chr14 ...
Processing chr19 ...
Processing chr18 ...
Processing chr8 ...
Processing chr3 ...
Processing chr1 ...
Processing chrY ...
Processing chrX ...
Processing chr9 ...
Processing chr22 ...
Processing chr20 ...
Processing chr21 ...
Processing chr7 ...
Processing chr6 ...
Processing chr5 ...
Processing chr4 ...
Processing chr2 ...
Run wigToBigWig out.wig /data2/bsi/staff_analysis/m102324/db_genome/genome/hg19.chrom.sizes out.bw
bam_stat.py
Summarizing mapping statistics of a BAM or SAM file.
This script determines “uniquely mapped reads” from mapping quality, which quality the probability that a read is misplaced (Do NOT confused with sequence quality, sequence quality measures the probability that a base-calling was wrong) .
- Options:
- --version
show program’s version number and exit
- -h, --help
show this help message and exit
- -i INPUT_FILE, --input-file=INPUT_FILE
Alignment file in BAM or SAM format.
- -q MAP_QUAL, --mapq=MAP_QUAL
Minimum mapping quality to determine uniquely mapped read.
Example:
bam_stat.py  -i Pairend_nonStrandSpecific_36mer_Human_hg19.bam

#Output (all numbers are read count)
#==================================================
Total records:                                 41465027
QC failed:                                     0
Optical/PCR duplicate:                         0
Non Primary Hits                               8720455
Unmapped reads:                                0

mapq < mapq_cut (non-unique):                  3127757
mapq >= mapq_cut (unique):                     29616815
Read-1:                                        14841738
Read-2:                                        14775077
Reads map to '+':                              14805391
Reads map to '-':                              14811424
Non-splice reads:                              25455360
Splice reads:                                  4161455
Reads mapped in proper pairs:                  21856264
Proper-paired reads map to different chrom:    7648
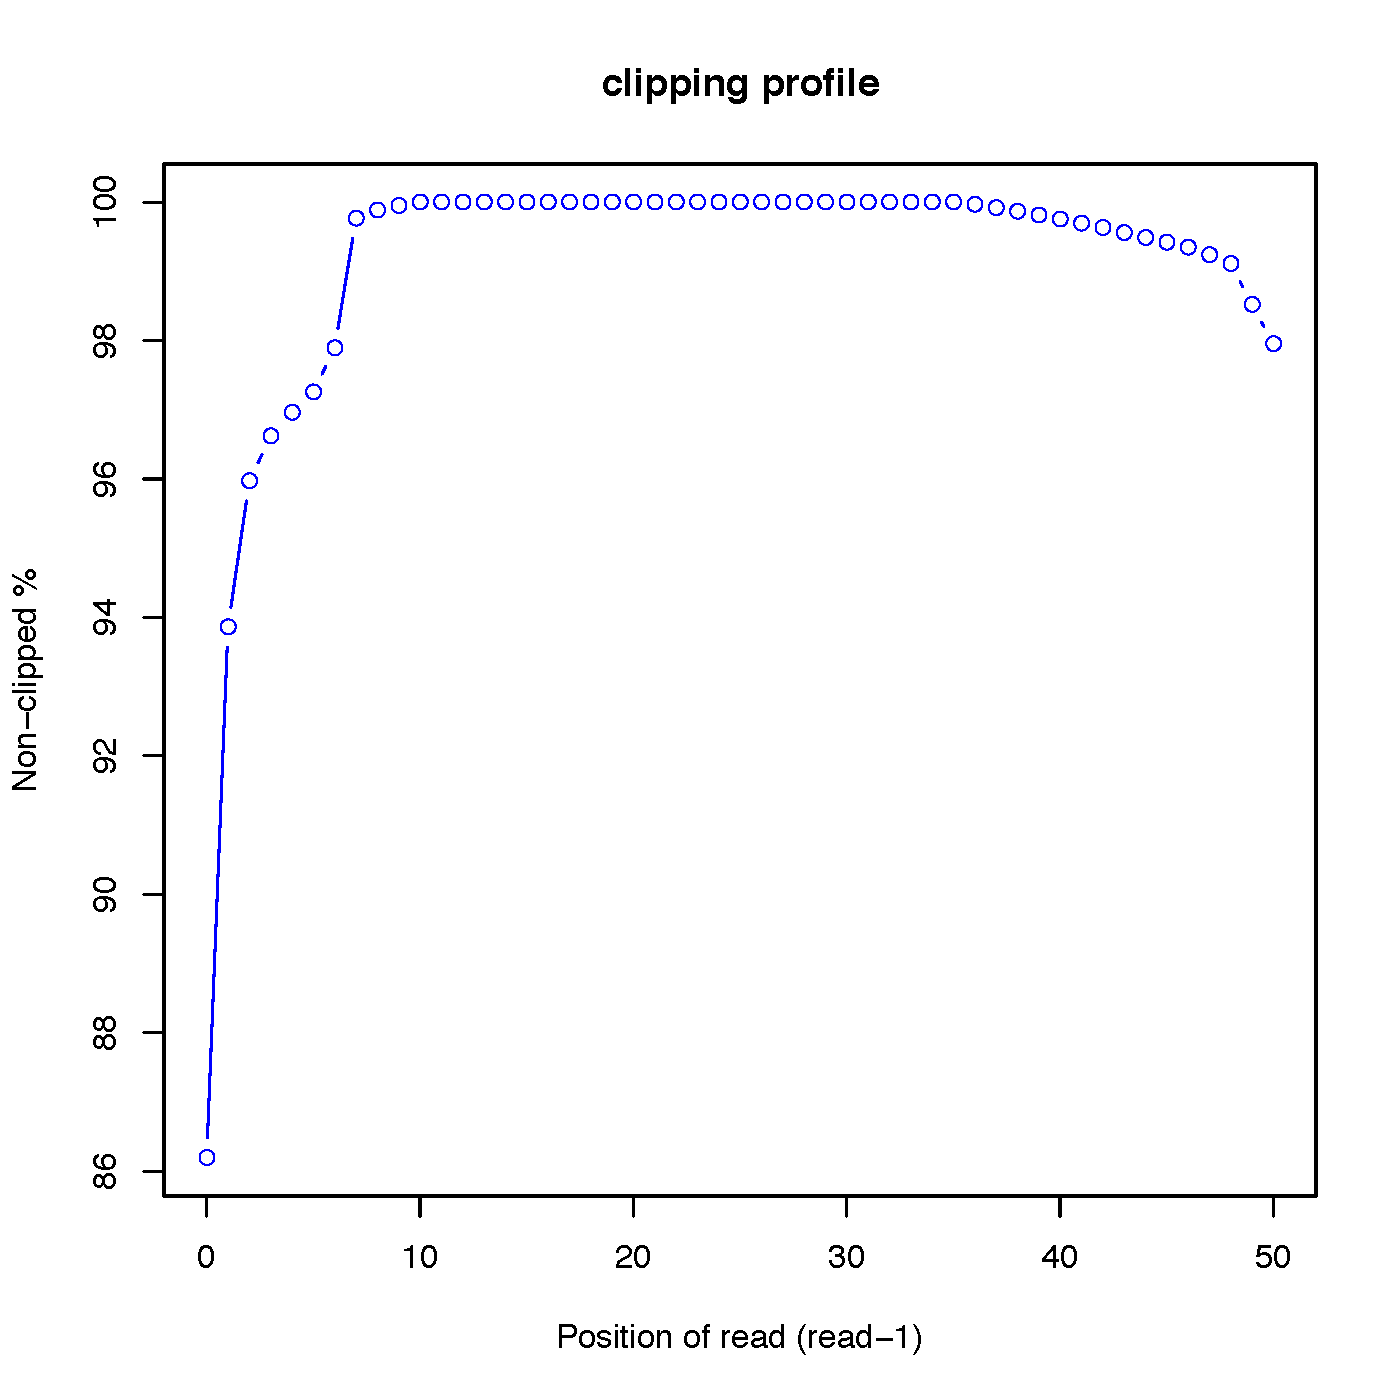
clipping_profile.py
Calculate the distributions of clipped nucleotides across reads
This program is used to estimate clipping profile of RNA-seq reads from BAM or SAM file. Note that to use this funciton, CIGAR strings within SAM/BAM file should have ‘S’ operation (This means your reads aligner should support clipped mapping).
- Options:
- --version
show program’s version number and exit
- -h, --help
show this help message and exit
- -i INPUT_FILE, --input-file=INPUT_FILE
Alignment file in BAM or SAM format.
- -o OUTPUT_PREFIX, --out-prefix=OUTPUT_PREFIX
Prefix of output files(s).
- -q MAP_QUAL, --mapq=MAP_QUAL
Minimum mapping quality (phred scaled) for an alignment to be considered as “uniquely mapped”. default=30
- -s LAYOUT, --sequencing=LAYOUT
Sequencing layout. “SE”(single-end) or “PE”(pair-end).
Example:
$ clipping_profile.py -i Pairend_StrandSpecific_51mer_Human_hg19.bam -s "PE" -o out

$ ls -l out.clipping_profile.* |awk '{print $9}'
out.clipping_profile.r
out.clipping_profile.R1.pdf
out.clipping_profile.R2.pdf
out.clipping_profile.xls
- NOTE:
Only 1 PDF file will be generated if -s “SE” was specified.
“out.clipping_profile.r” is the R script file used to generate pdf file(s).
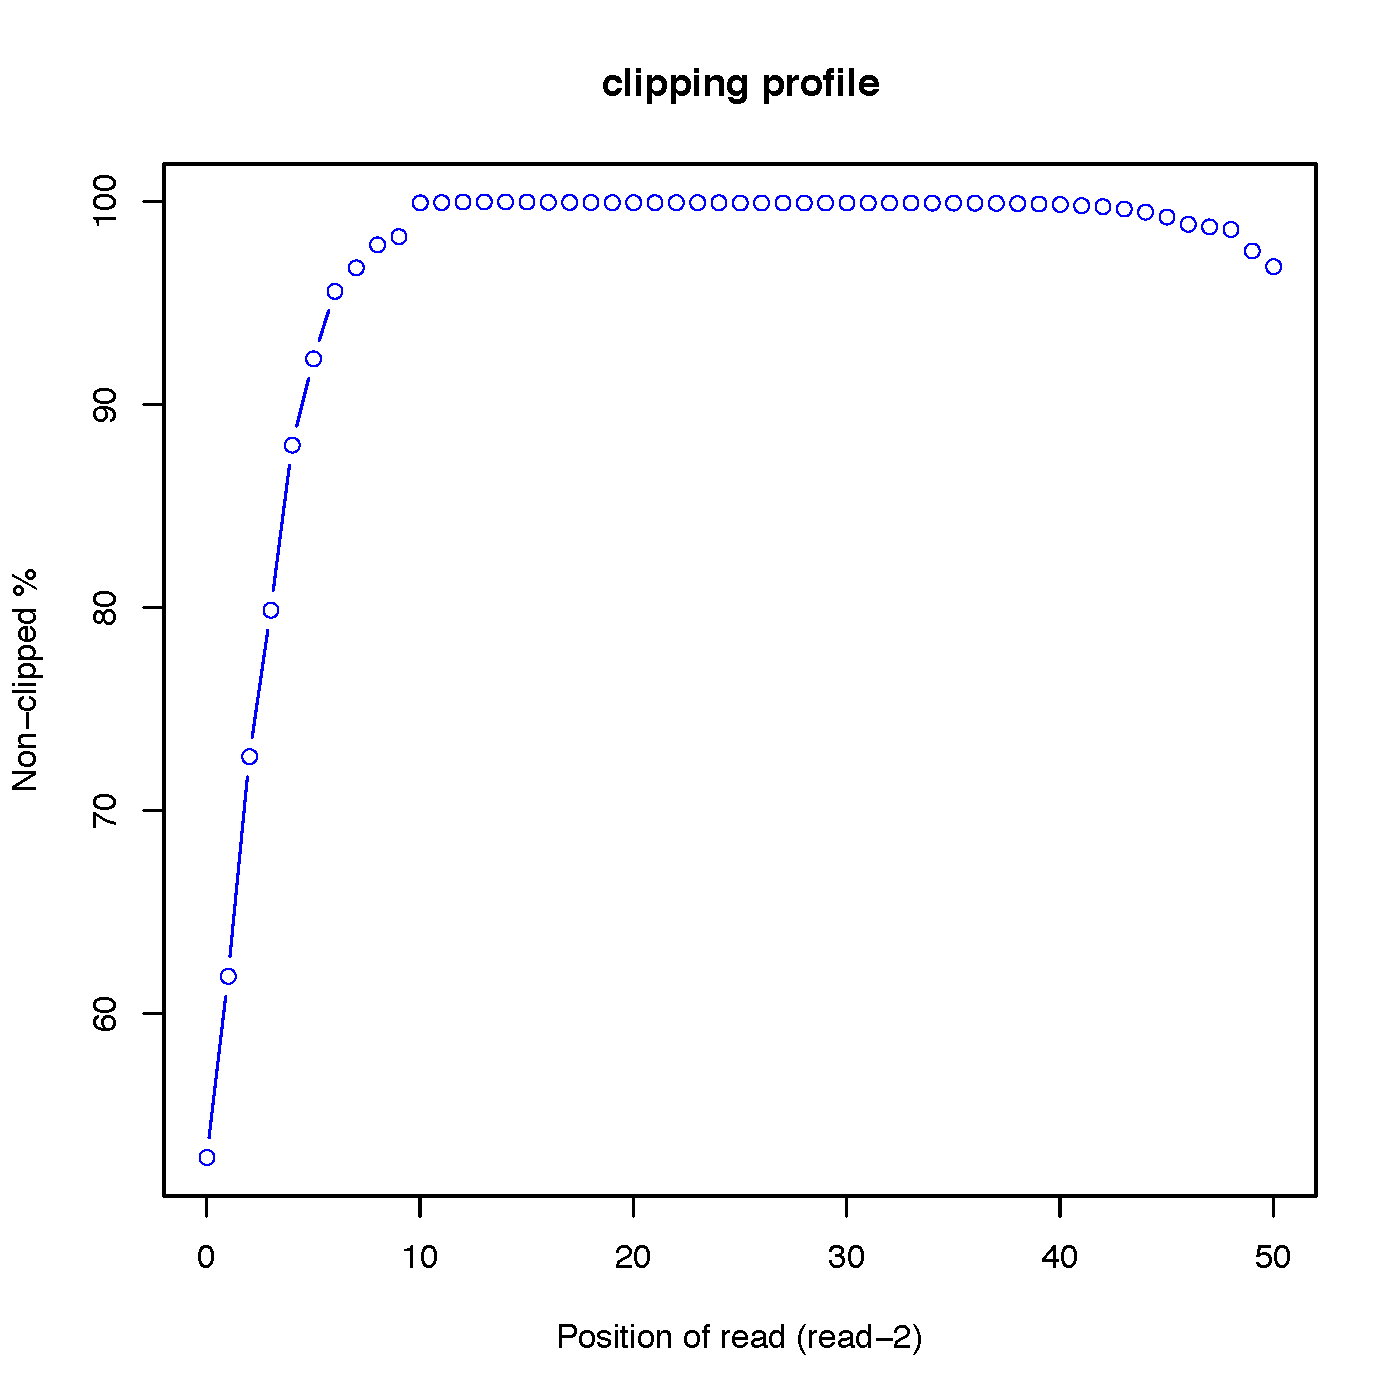
“out.clipping_profile.xls” contains 3 columns: the first column is position (starting from 0) of read in 5’->3’ direction; the second column is the number of reads clipped at this position; the third column is the number of reads non-clipped at this position.
Read-1 clipping profile:
Read-2 clipping profile:
deletion_profile.py
Calculate the distributions of deletions across reads
- Options:
- --version
show program’s version number and exit
- -h, --help
show this help message and exit
- -i INPUT_BAM, --input=INPUT_BAM
Input BAM file. [required]
- -l READ_ALIGNMENT_LENGTH, --read-align-length=READ_ALIGNMENT_LENGTH
Alignment length of read. It is usually set to the orignial read length. For example, all these cigar strings (“101M”, “68M140N33M”, “53M1D48M”) suggest the read alignment length is 101. [required]
- -o OUTPUT_PREFIX, --out-prefix=OUTPUT_PREFIX
Prefix of output files(s). [required]
- -n READ_NUMBER, --read-num=READ_NUMBER
Number of aligned reads with mismatches used to calculate the mismatch profile. default=1000000
- -q MAP_QUAL, --mapq=MAP_QUAL
Minimum mapping quality. default=30
Example:
$ python2.7  deletion_profile.py -i sample.bam -l 101 -o out
Process BAM file ...  Total reads used: 58310

$ ls -l out.deletion_profile.* |awk '{print $9}'
out.deletion_profile.pdf
out.deletion_profile.r
out.deletion_profile.txt

divide_bam.py
Equally divide BAM file (m alignments) into n parts. Each part contains roughly m/n alignments that are randomly sampled from total alignments.
- Options:
- --version
show program’s version number and exit
- -h, --help
show this help message and exit
- -i INPUT_FILE, --input-file=INPUT_FILE
Alignment file in BAM format. BAM file should be sorted and indexed.
- -n SUBSET_NUM, --subset-num=SUBSET_NUM
Number of small BAM files
- -o OUTPUT_PREFIX, --out-prefix=OUTPUT_PREFIX
Prefix of output BAM files. Output “Prefix_num.bam”.
- -s, --skip-unmap
Skip unmapped reads.
Example:
python2.7 divide_bam.py -n 3 -i SingleEnd_StrandSpecific_50mer_Human_hg19.bam -o output
Dividing SingleEnd_StrandSpecific_50mer_Human_hg19.bam ... Done
output_0.bam                                           22179548
output_1.bam                                           22185659
output_2.bam                                           22187574
FPKM_count.py
Calculate raw read count, FPM (fragment per million) and FPKM (fragment per million mapped reads per kilobase exon) for each gene in BED file. Note: SAM file is not supported.
- Options:
- --version
show program’s version number and exit
- -h, --help
show this help message and exit
- -i INPUT_FILE, --input-file=INPUT_FILE
Alignment file in BAM format (SAM is not supported). [required]
- -o OUTPUT_PREFIX, --out-prefix=OUTPUT_PREFIX
Prefix of output files(s). [required]
- -r REFGENE_BED, --refgene=REFGENE_BED
Reference gene model in bed fomat. [required]
- -d STRAND_RULE, --strand=STRAND_RULE
How read(s) were stranded during sequencing. For example: –strand=’1++,1–,2+-,2-+’ means that this is a pair-end, strand-specific RNA-seq, and the strand rule is: read1 mapped to ‘+’ => parental gene on ‘+’; read1 mapped to ‘-’ => parental gene on ‘-’; read2 mapped to ‘+’ => parental gene on ‘-’; read2 mapped to ‘-’ => parental gene on ‘+’. If you are not sure about the strand rule, run ‘infer_experiment.py’ default=none (Not a strand specific RNA-seq data)
- -u, --skip-multi-hits
How to deal with multiple hit reads. Presence this option renders program to skip multiple hits reads.
- -e, --only-exonic
How to count total reads. Presence of this option renders program only used exonic (UTR exons and CDS exons) reads, otherwise use all reads.
- -q MAP_QUAL, --mapq=MAP_QUAL
Minimum mapping quality (phred scaled) for an alignment to be called “uniquely mapped”. default=30
- -s SINGLE_READ, --single-read=SINGLE_READ
How to count read-pairs that only have one end mapped. 0: ignore it. 0.5: treat it as half fragment. 1: treat it as whole fragment. default=1
Output:
#chrom |
st |
end |
accession |
mRNA_size |
gene_strand |
Frag_count |
FPM |
FPKM |
|---|---|---|---|---|---|---|---|---|
chr1 |
100652477 |
100715409 |
NM_001918 |
10815.0 |
‘-’ |
5498.0 |
191.73788949 |
17.728884835 |
chr1 |
175913961 |
176176380 |
NM_022457 |
2789.0 |
‘-’ |
923.0 |
32.188809021 |
11.541344217 |
chr1 |
150980972 |
151008189 |
NM_021222 |
2977.0 |
‘+’ |
687.0 |
23.958517657 |
8.0478729115 |
chr1 |
6281252 |
6296044 |
NM_012405 |
4815.0 |
‘-’ |
1396.0 |
48.684265866 |
10.11095864 |
chr1 |
20959947 |
20978004 |
NM_032409 |
2660.0 |
‘+’ |
509.0 |
17.750925018 |
6.6732800821 |
chr1 |
32479294 |
32509482 |
NM_006559 |
2891.0 |
‘+’ |
2151.0 |
75.014223408 |
25.947500314 |
FPKM-UQ.py
Calculate count, FPKM, and FPKM-UQ values defined by TCGA
Note
This program generates exactly the same FPKM and FPKM-UQ values as TCGA, if:
you use the TCGA BAM file, or follow the TCGA RNA-seq workflow to generate your own BAM file.
use the GENCODE v22 GTF file.
use the GENCODE v22 information file.
you must install HTSeq. And the ‘htseq-count’ command is callable.
- Options:
- --version
show program’s version number and exit
- -h, --help
show this help message and exit
- --bam=BAM_FILE
Alignment file in BAM format. BAM file shoul be sorted and indexed. Ideally, the BAM file should generaet from the TCGA RNA-seq analysis workflow described here.
- --gtf=GTF_FILE
Gene model in GTF format.
- --info=INFOR_FILE
Gene model information file.
- -o OUT_FILE, --output=OUT_FILE
The prefix of the output file.
- --log2
Convert FPKM and FPKM-UQ values into log2 (x+1) scale. A pseudo count 1 will be added to each gene/transcript.
Example (analyze kidney cancer BAM file, TCGA barcode is : “TCGA-B0-4821”):
FPKM-UQ.py --bam 8e5c811c-132a-4f27-b7ef-1a4a644f9079_gdc_realn_rehead.bam --gtf gencode.v22.annotation.gtf --info gencode.gene.info.v22.tsv -o output
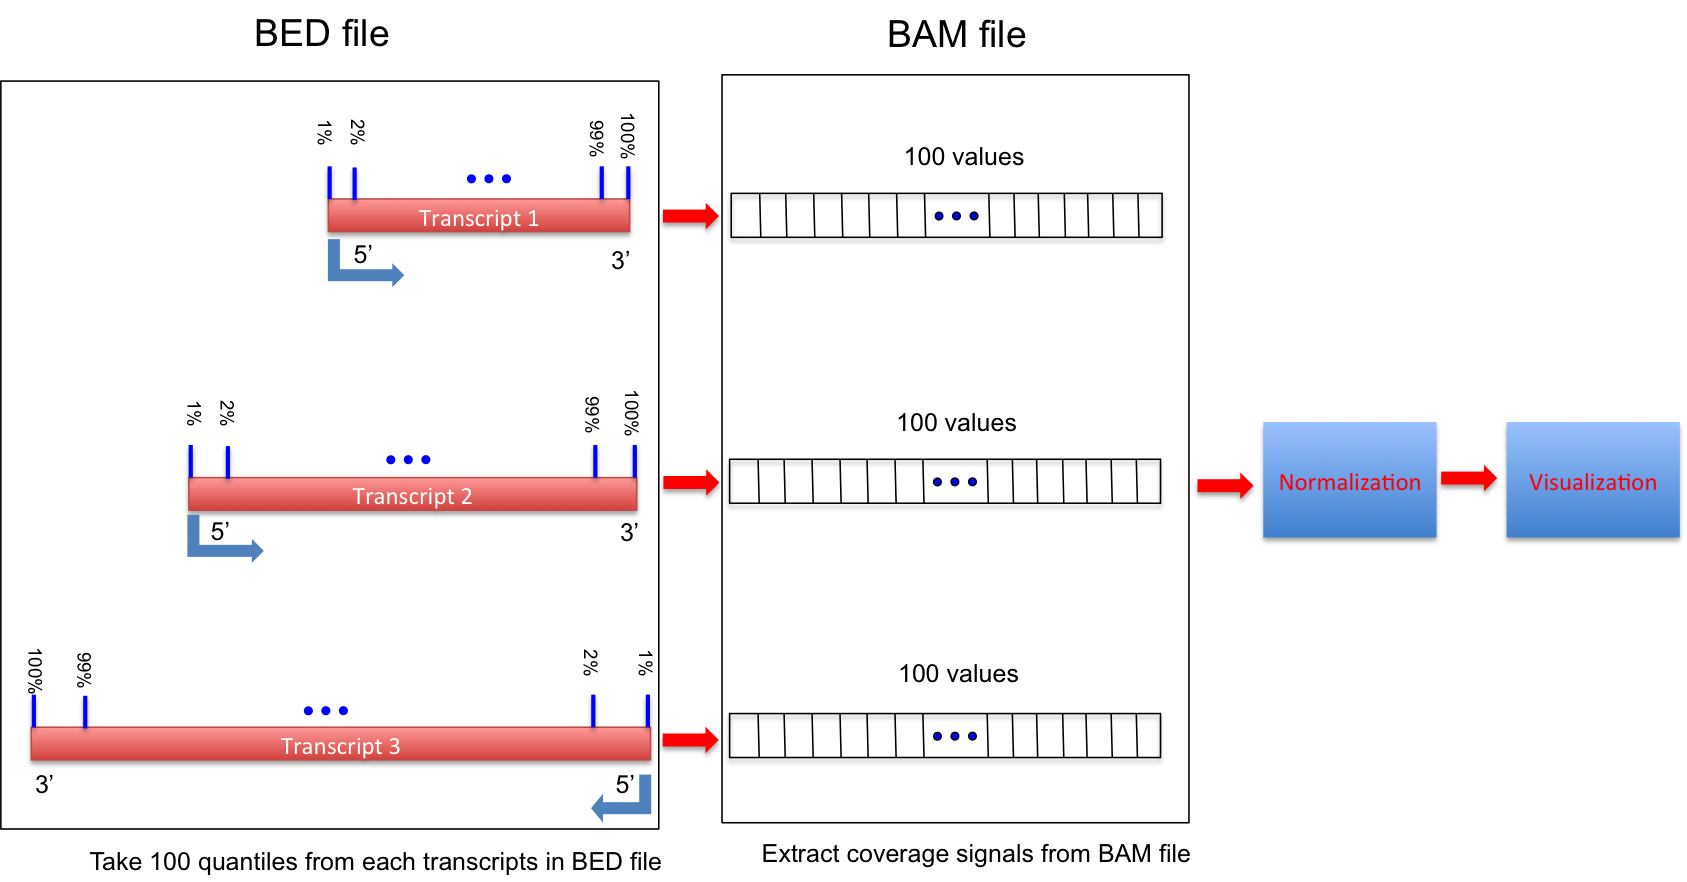
geneBody_coverage.py
Calculate the RNA-seq reads coverage over gene body.
Ihis workflow is illustrated below:
If 3 or more BAM files were provided. This program generated a lineGraph and a heatmap. If less than 3 BAM files were provided, only lineGraph was generated. See below for examples.
When heatmap was generated, samples were ranked by the “skewness” of the coverage: Sample with best (worst) coverage will be displayed at the top (bottom) of the heatmap.
Coverage skewness was measured by Pearson’s skewness coefficients
NOTE:
Only input sorted and indexed BAM file(s).
Genes/transcripts with mRNA length < 100 will be skipped (Number specified to “-l” cannot be < 100).
- Options:
- --version
show program’s version number and exit
- -h, --help
show this help message and exit
- -i INPUT_FILES, --input=INPUT_FILES
Input file(s) in BAM format. “-i” takes these input: 1) a single BAM file. 2) “,” separated BAM files. 3) directory containing one or more bam files. 4) plain text file containing the path of one or more bam file (Each row is a BAM file path). All BAM files should be sorted and indexed using samtools.
- -r REF_GENE_MODEL, --refgene=REF_GENE_MODEL
Reference gene model in bed format. [required]
- -l MIN_MRNA_LENGTH, --minimum_length=MIN_MRNA_LENGTH
Minimum mRNA length (bp). mRNA smaller than “min_mRNA_length” will be skipped. default=100
- -f OUTPUT_FORMAT, --format=OUTPUT_FORMAT
Output file format, ‘pdf’, ‘png’ or ‘jpeg’. default=pdf
- -o OUTPUT_PREFIX, --out-prefix=OUTPUT_PREFIX
Prefix of output files(s). [required]
Example:
A single BAM file.
$ geneBody_coverage.py -r hg19.housekeeping.bed -i test.bam -o output
2. A list of BAM files separated by “,”.
$ geneBody_coverage.py -r hg19.housekeeping.bed -i test1.bam,test2.bam,test3.bam -o output
3. Plain text file containing the paths of BAM files.
$ geneBody_coverage.py -r hg19.housekeeping.bed -i bam_path.txt  -o output
$ cat  bam_path.txt
/data/alignment/test1.bam
/data/alignment/test2.bam
/data/alignment/test3.bam
4. A directory containing BAM files.
$ geneBody_coverage.py -r hg19.housekeeping.bed -i /data/alignment/ -o output
Output:


geneBody_coverage2.py
Calculate the RNA-seq reads coverage over gene body. This module uses bigwig file as input.
- Options:
- --version
show program’s version number and exit
- -h, --help
show this help message and exit
- -i INPUT_FILE, --input-file=INPUT_FILE
Coverage signal file in bigwig format
- -r REF_GENE_MODEL, --refgene=REF_GENE_MODEL
Reference gene model in bed format. [required]
- -o OUTPUT_PREFIX, --out-prefix=OUTPUT_PREFIX
Prefix of output files(s). [required]
- -t GRAPH_TYPE, --graph-type=GRAPH_TYPE
Graphic file type in “pdf”, “jpeg”, “bmp”, “bmp”, “tiff” or “png”.default=png [optional]
infer_experiment.py
This program is used to “guess” how RNA-seq sequencing were configured, particulary how reads were stranded for strand-specific RNA-seq data, through comparing the “strandness of reads” with the “standness of transcripts”.
The “strandness of reads” is determiend from alignment, and the “standness of transcripts” is determined from annotation.
For non strand-specific RNA-seq data, “strandness of reads” and “standness of transcripts” are independent.
For strand-specific RNA-seq data, “strandness of reads” is largely determined by “standness of transcripts”. See below 3 examples for details.
You don’t need to know the RNA sequencing protocol before mapping your reads to the reference genome. Mapping your RNA-seq reads as if they were non-strand specific, this script can “guess” how RNA-seq reads were stranded.
For pair-end RNA-seq, there are two different ways to strand reads (such as Illumina ScriptSeq protocol):
1++,1–,2+-,2-+
read1 mapped to ‘+’ strand indicates parental gene on ‘+’ strand
read1 mapped to ‘-’ strand indicates parental gene on ‘-’ strand
read2 mapped to ‘+’ strand indicates parental gene on ‘-’ strand
read2 mapped to ‘-’ strand indicates parental gene on ‘+’ strand
1+-,1-+,2++,2–
read1 mapped to ‘+’ strand indicates parental gene on ‘-’ strand
read1 mapped to ‘-’ strand indicates parental gene on ‘+’ strand
read2 mapped to ‘+’ strand indicates parental gene on ‘+’ strand
read2 mapped to ‘-’ strand indicates parental gene on ‘-’ strand
For single-end RNA-seq, there are also two different ways to strand reads:
++,–
read mapped to ‘+’ strand indicates parental gene on ‘+’ strand
read mapped to ‘-’ strand indicates parental gene on ‘-’ strand
+-,-+
read mapped to ‘+’ strand indicates parental gene on ‘-’ strand
read mapped to ‘-’ strand indicates parental gene on ‘+’ strand
- Options:
- --version
show program’s version number and exit
- -h, --help
show this help message and exit
- -i INPUT_FILE, --input-file=INPUT_FILE
Input alignment file in SAM or BAM format
- -r REFGENE_BED, --refgene=REFGENE_BED
Reference gene model in bed fomat.
- -s SAMPLE_SIZE, --sample-size=SAMPLE_SIZE
Number of reads sampled from SAM/BAM file. default=200000
- -q MAP_QUAL, --mapq=MAP_QUAL
Minimum mapping quality (phred scaled) for an alignment to be considered as “uniquely mapped”. default=30
Example 1: Pair-end non strand specific:
infer_experiment.py -r hg19.refseq.bed12 -i Pairend_nonStrandSpecific_36mer_Human_hg19.bam

#Output::

This is PairEnd Data
Fraction of reads failed to determine: 0.0172
Fraction of reads explained by "1++,1--,2+-,2-+": 0.4903
Fraction of reads explained by "1+-,1-+,2++,2--": 0.4925
Interpretation: 1.72% of total reads were mapped to genome regions that we cannot determine the “standness of transcripts” (such as regions that having both strands transcribed). For the remaining 98.28% (1 - 0.0172 = 0.9828) of reads, half can be explained by “1++,1–,2+-,2-+”, while the other half can be explained by “1+-,1-+,2++,2–“. We conclude that this is NOT a strand specific dataset because “strandness of reads” was independent of “standness of transcripts”
Example 2: Pair-end strand specific:
infer_experiment.py -r hg19.refseq.bed12 -i Pairend_StrandSpecific_51mer_Human_hg19.bam

#Output::

This is PairEnd Data
Fraction of reads failed to determine: 0.0072
Fraction of reads explained by "1++,1--,2+-,2-+": 0.9441
Fraction of reads explained by "1+-,1-+,2++,2--": 0.0487
Interpretation: 0.72% of total reads were mapped to genome regions that we cannot determine the “standness of transcripts” (such as regions that having both strands transcribed). For the remaining 99.28% (1 - 0.0072 = 0.9928) of reads, the vast majority was explained by “1++,1–,2+-,2-+”, suggesting a strand-specific dataset.
Example 3: Single-end strand specific:
infer_experiment.py -r hg19.refseq.bed12 -i SingleEnd_StrandSpecific_36mer_Human_hg19.bam

#Output::

This is SingleEnd Data
Fraction of reads failed to determine: 0.0170
Fraction of reads explained by "++,--": 0.9669
Fraction of reads explained by "+-,-+": 0.0161
Interpretation: This is single-end, strand specific RNA-seq data. Strandness of reads are concordant with strandness of reference gene.
inner_distance.py
Calculate inner distance between read pairs.
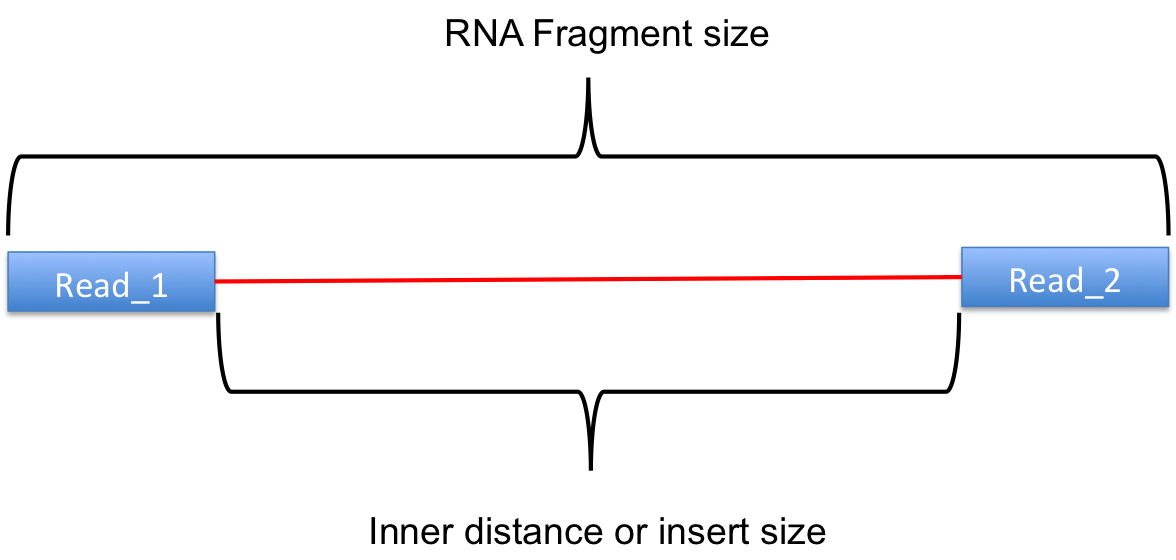
This module is used to calculate the inner distance (or insert size) between two paired RNA reads. The distance is the mRNA length between two paired fragments. We first determine the genomic (DNA) size between two paired reads: D_size = read2_start - read1_end, then
if two paired reads map to the same exon: inner distance = D_size
if two paired reads map to different exons:inner distance = D_size - intron_size
if two paired reads map non-exonic region (such as intron and intergenic region): inner distance = D_size
The inner_distance might be a negative value if two fragments were overlapped.
NOTE: Not all read pairs were used to estimate the inner distance distribution. Those low quality, PCR duplication, multiple mapped reads were skipped.
- Options:
- --version
show program’s version number and exit
- -h, --help
show this help message and exit
- -i INPUT_FILE, --input-file=INPUT_FILE
Alignment file in BAM or SAM format.
- -o OUTPUT_PREFIX, --out-prefix=OUTPUT_PREFIX
Prefix of output files(s)
- -r REF_GENE, --refgene=REF_GENE
Reference gene model in BED format.
- -k SAMPLESIZE, --sample-size=SAMPLESIZE
Number of read-pairs used to estimate inner distance. default=1000000
- -l LOWER_BOUND_SIZE, --lower-bound=LOWER_BOUND_SIZE
Lower bound of inner distance (bp). This option is used for ploting histograme. default=-250
- -u UPPER_BOUND_SIZE, --upper-bound=UPPER_BOUND_SIZE
Upper bound of inner distance (bp). This option is used for plotting histogram. default=250
- -s STEP_SIZE, --step=STEP_SIZE
Step size (bp) of histograme. This option is used for plotting histogram. default=5
- -q MAP_QUAL, --mapq=MAP_QUAL
Minimum mapping quality (phred scaled) for an alignment to be called “uniquely mapped”. default=30
Example:
inner_distance.py -i Pairend_nonStrandSpecific_36mer_Human_hg19.bam -o output -r hg19.refseq.bed12
Output:

insertion_profile.py
Calculate the distributions of inserted nucleotides across reads. Note that to use this funciton, CIGAR strings within SAM/BAM file should have ‘I’ operation
- Options:
- --version
show program’s version number and exit
- -h, --help
show this help message and exit
- -i INPUT_FILE, --input-file=INPUT_FILE
Alignment file in BAM or SAM format.
- -o OUTPUT_PREFIX, --out-prefix=OUTPUT_PREFIX
Prefix of output files(s).
- -q MAP_QUAL, --mapq=MAP_QUAL
Minimum mapping quality (phred scaled) for an alignment to be considered as “uniquely mapped”. default=30
- -s LAYOUT, --sequencing=LAYOUT
Sequencing layout. “SE”(single-end) or “PE”(pair-end).
Example:
$ python2.7 insertion_profile.py -s "PE" -i test.bam -o out

$ ls -l out.insertion_profile.* |awk '{print $9}'
out.insertion_profile.r
out.insertion_profile.R1.pdf
out.insertion_profile.R2.pdf
out.insertion_profile.xls
Read-1 insertion profile:
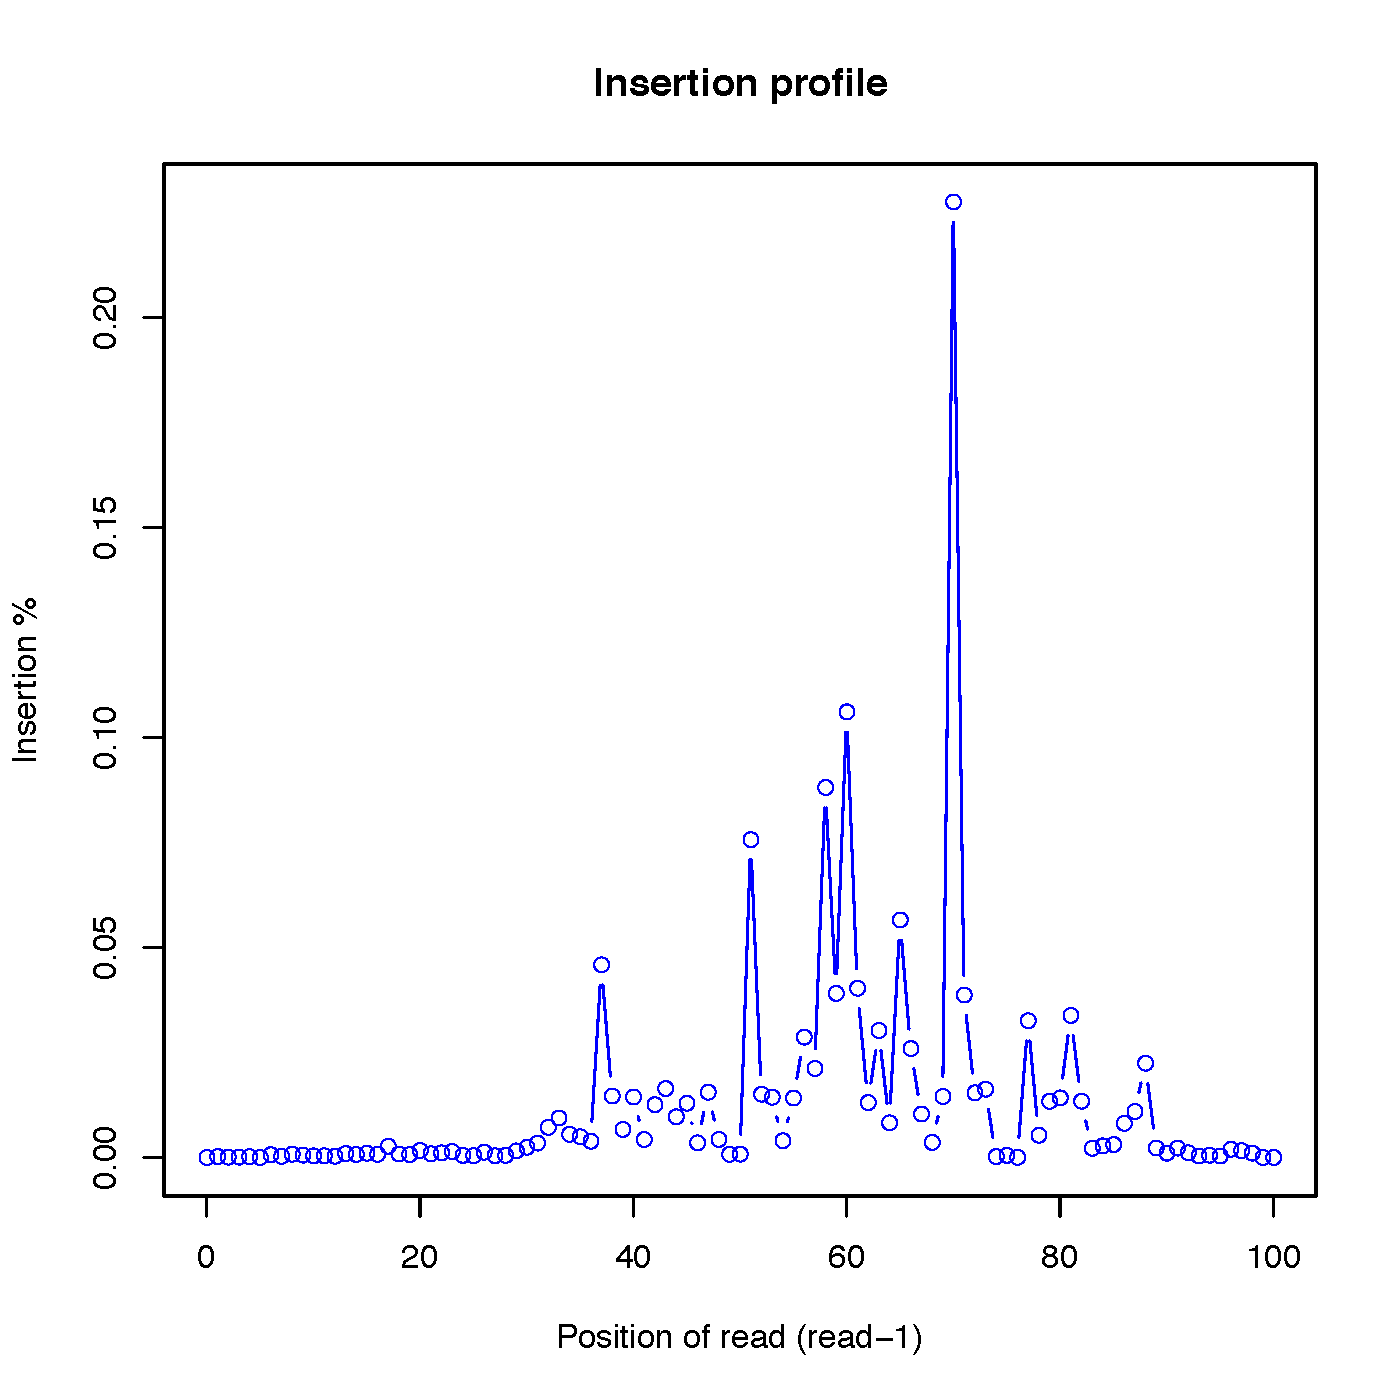
Read-2 insertion profile:

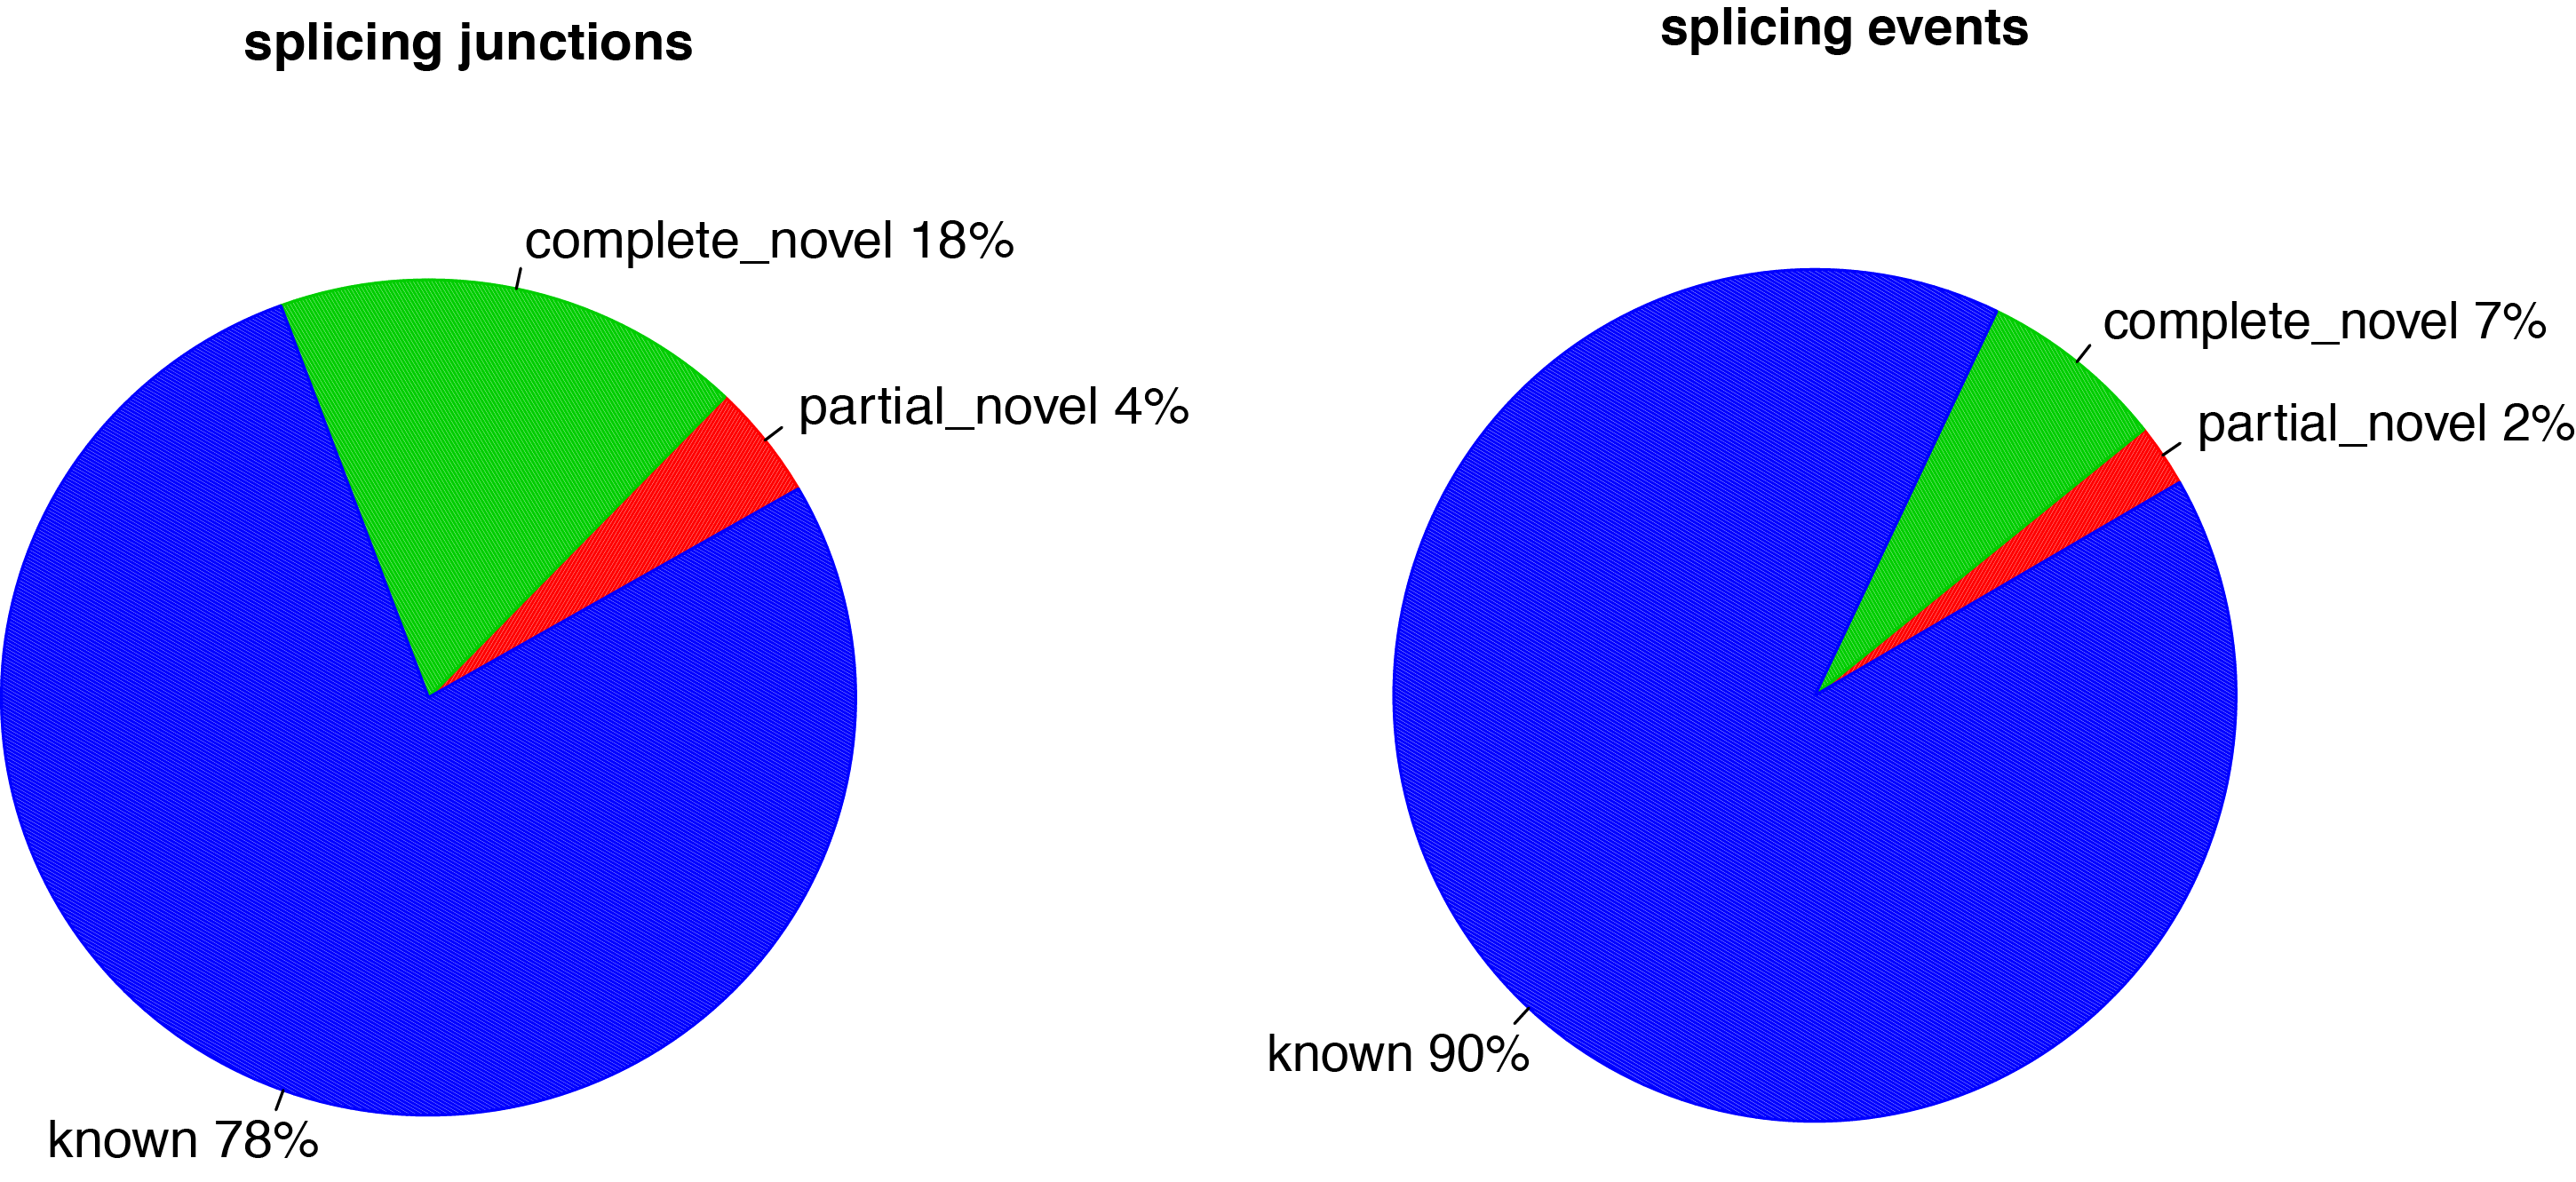
junction_annotation.py
For a given alignment file (-i) in BAM or SAM format and a reference gene model (-r) in BED format, this program will compare detected splice junctions to reference gene model. splicing annotation is performed in two levels: splice event level and splice junction level.
splice read: An RNA read, especially long read, can be spliced more than once, therefore, 100 spliced reads can produce >= 100 splicing events.
splice junction: multiple splicing events spanning the same intron can be consolidated into one splicing junction.
Detected junctions were divided to 3 exclusive categories:
Annotated (known): The junction is part of the gene model. Both splice sites, 5’ splice site (5’SS) and 3’splice site (3’SS) are annotated by reference gene model.
Complete_novel: Both 5’SS and 3’SS are novel.
Partial_novel: One of the splice site (5’SS or 3’SS) is novel, and the other splice site is annotated
- Options:
- --version
show program’s version number and exit
- -h, --help
show this help message and exit
- -i INPUT_FILE, --input-file=INPUT_FILE
Alignment file in BAM or SAM format.
- -r REF_GENE_MODEL, --refgene=REF_GENE_MODEL
Reference gene model in bed format. This file is better to be a pooled gene model as it will be used to annotate splicing junctions [required]
- -o OUTPUT_PREFIX, --out-prefix=OUTPUT_PREFIX
Prefix of output files(s). [required]
- -m MIN_INTRON, --min-intron=MIN_INTRON
Minimum intron length (bp). default=50 [optional]
- -q MAP_QUAL, --mapq=MAP_QUAL
Minimum mapping quality (phred scaled) for an alignment to be considered as “uniquely mapped”. default=30
Example:
junction_annotation.py -i Pairend_nonStrandSpecific_36mer_Human_hg19.bam -o output -r hg19.refseq.bed12
Output:
Distribution of complete_novel, partial_novel and known junctions (splicing events).
The produced Interact file can be uploaded into the UCSC genome browser for visualization. If this file is too large to upload to the UCSC genome browser directly, try to convert this Interact file into bigInteract file (using the bedToBigBed program following this instruction). Complete_novel, partial_novel and known junctions will be indicated with arcs of different colors.
junction_saturation.py
It’s very important to check if current sequencing depth is deep enough to perform alternative splicing analyses. For a well annotated organism, the number of expressed genes in particular tissue is almost fixed so the number of splice junctions is also fixed. The fixed splice junctions can be predetermined from reference gene model. All (annotated) splice junctions should be rediscovered from a saturated RNA-seq data, otherwise, downstream alternative splicing analysis is problematic because low abundance splice junctions are missing. This module checks for saturation by resampling 5%, 10%, 15%, …, 95% of total alignments from BAM or SAM file, and then detects splice junctions from each subset and compares them to reference gene model.
- Options:
- --version
show program’s version number and exit
- -h, --help
show this help message and exit
- -i INPUT_FILE, --input-file=INPUT_FILE
Alignment file in BAM or SAM format.[required]
- -o OUTPUT_PREFIX, --out-prefix=OUTPUT_PREFIX
Prefix of output files(s). [required]
- -r REFGENE_BED, --refgene=REFGENE_BED
Reference gene model in bed fomat. This gene model is used to determine known splicing junctions. [required]
- -l PERCENTILE_LOW_BOUND, --percentile-floor=PERCENTILE_LOW_BOUND
Sampling starts from this percentile. A integer between 0 and 100. default=5
- -u PERCENTILE_UP_BOUND, --percentile-ceiling=PERCENTILE_UP_BOUND
Sampling ends at this percentile. A integer between 0 and 100. default=100
- -s PERCENTILE_STEP, --percentile-step=PERCENTILE_STEP
Sampling frequency. Smaller value means more sampling times. A integer between 0 and 100. default=5
- -m MINIMUM_INTRON_SIZE, --min-intron=MINIMUM_INTRON_SIZE
Minimum intron size (bp). default=50
- -v MINIMUM_SPLICE_READ, --min-coverage=MINIMUM_SPLICE_READ
Minimum number of supportting reads to call a junction. default=1
- -q MAP_QUAL, --mapq=MAP_QUAL
Minimum mapping quality (phred scaled) for an alignment to be called “uniquely mapped”. default=30
Example:
junction_saturation.py -i Pairend_nonStrandSpecific_36mer_Human_hg19.bam -r hg19.refseq.bed12 -o output
Output:

In this example, current sequencing depth is almost saturated for “known junction” (red line) detection because the number of “known junction” reaches a plateau. In other words, nearly all “known junctions” (expressed in this particular tissue) have already been detected, and deeper sequencing will not likely to detect additional “known junction” and will only increase junction coverage (i.e. junction covered by more reads). While current sequencing depth is not saturated for novel junctions (green).
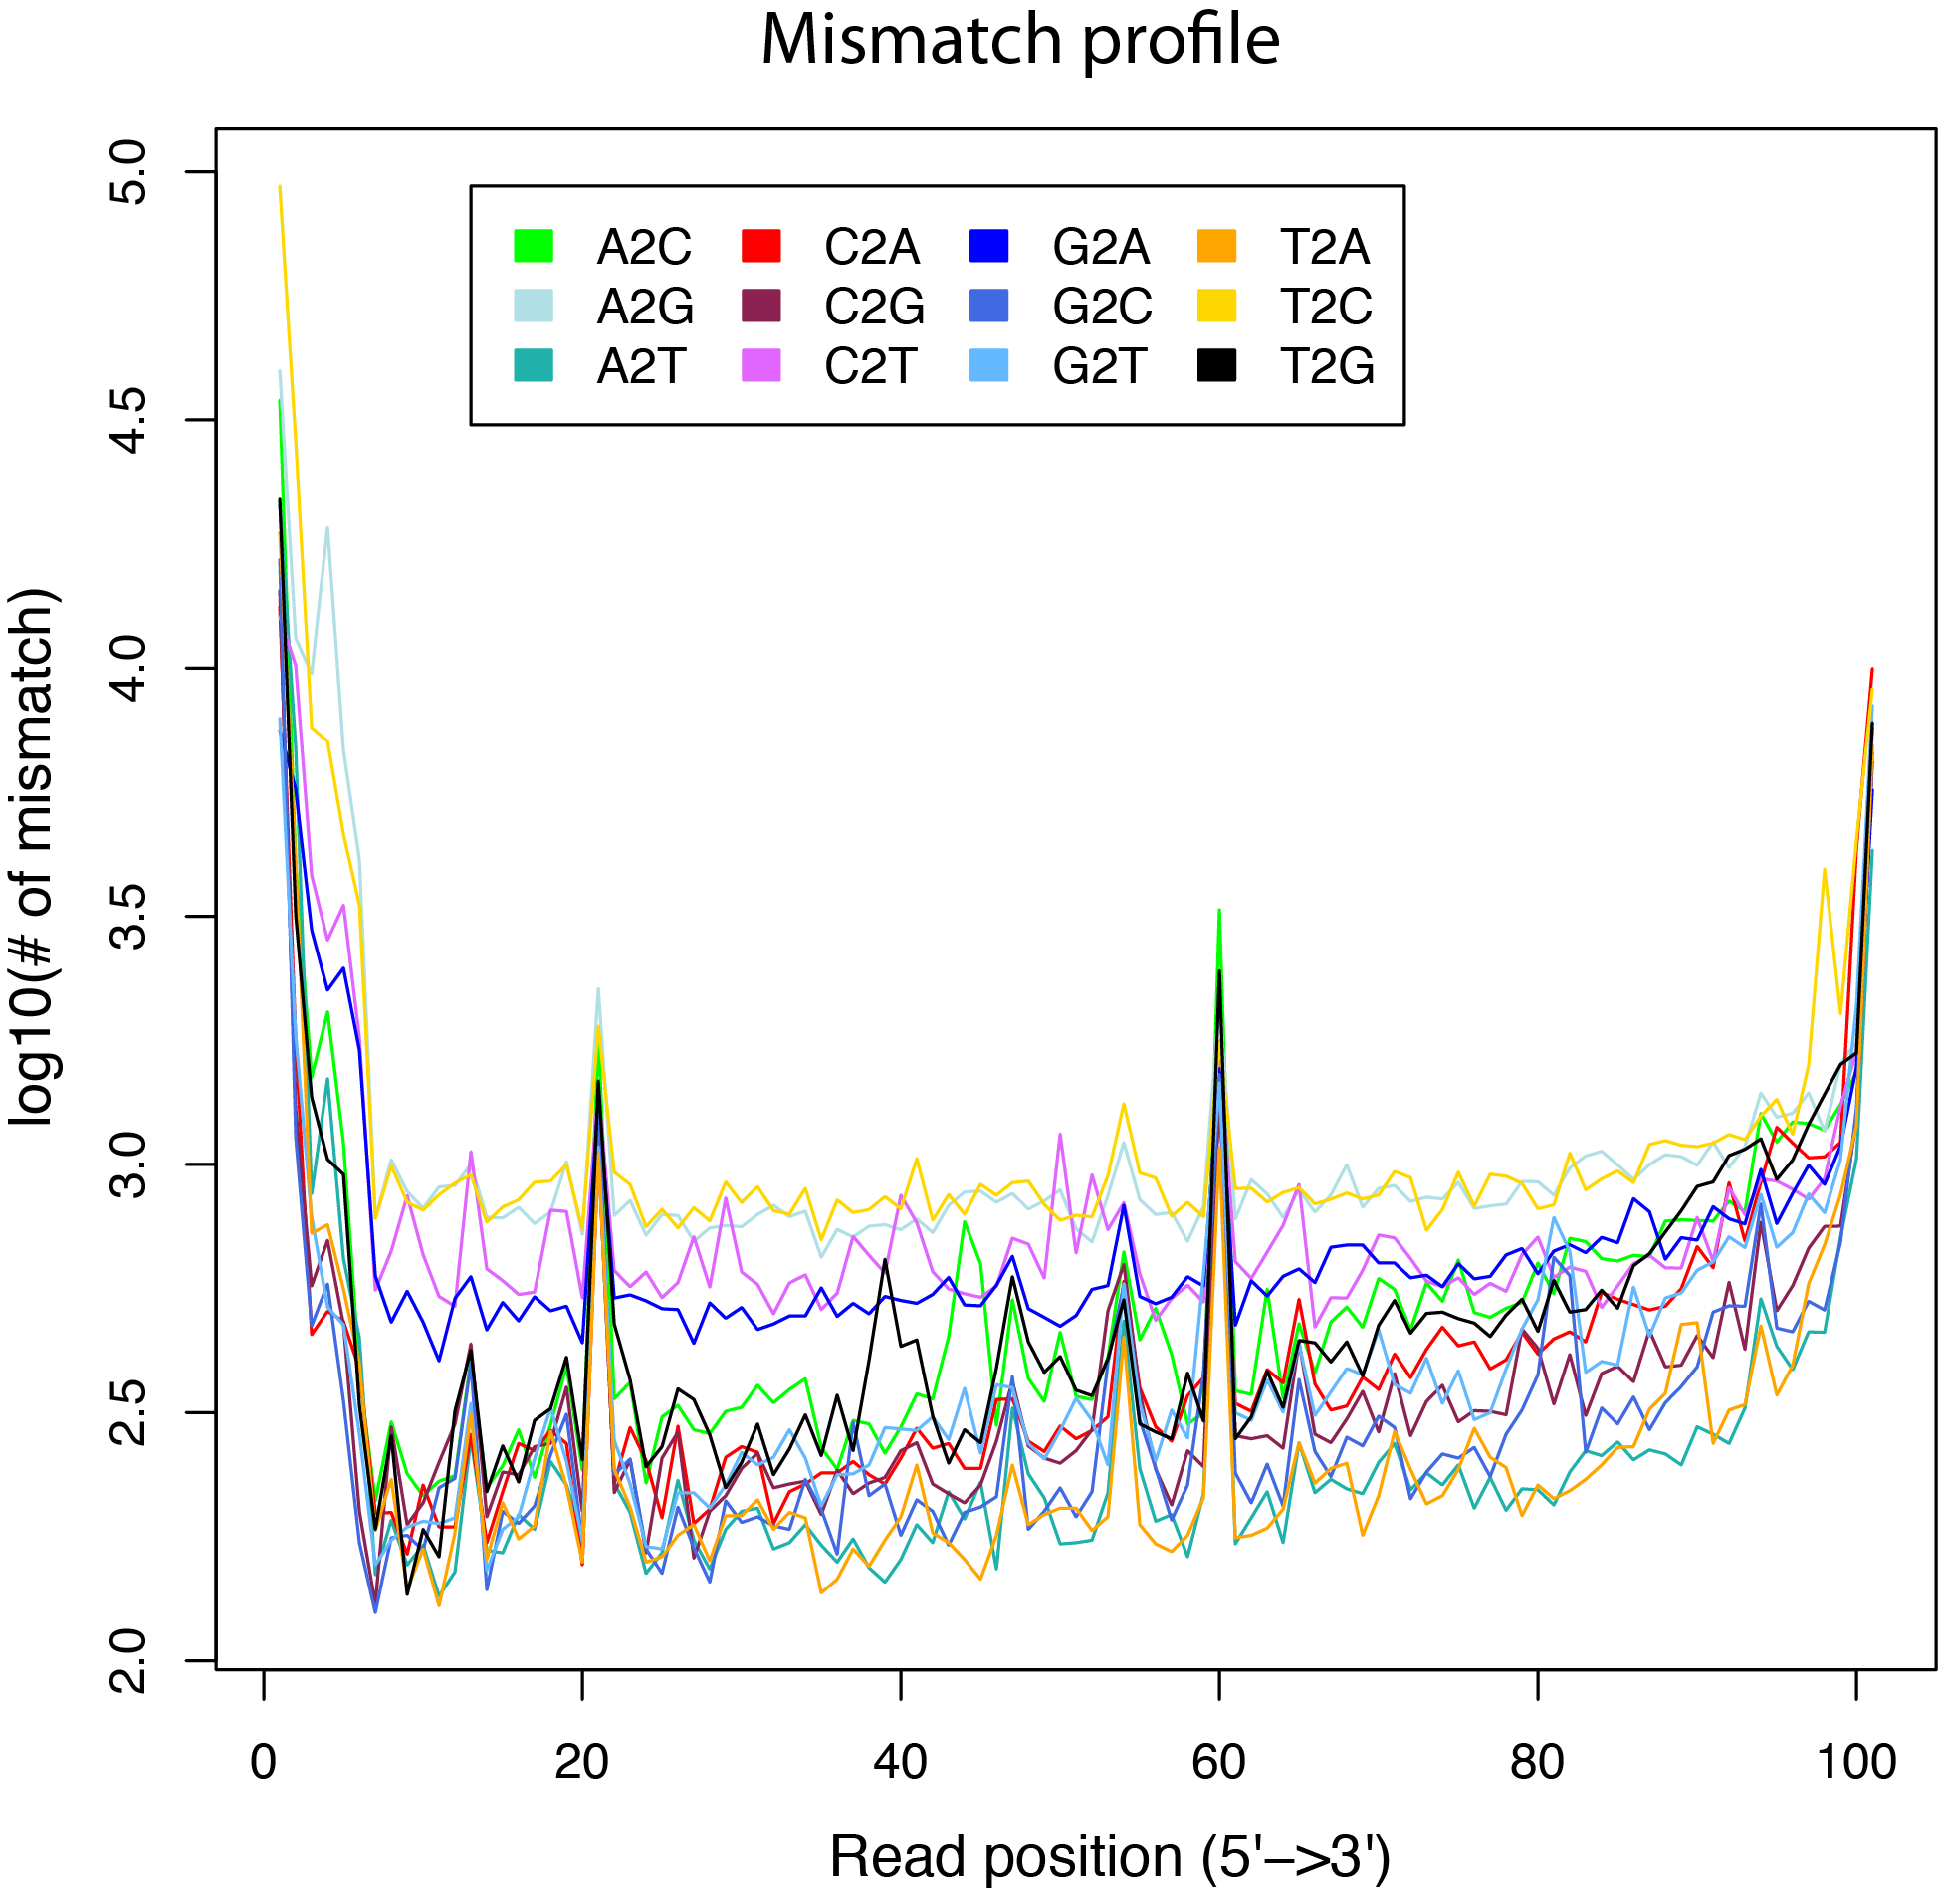
mismatch_profile.py
Calculate the distribution of mismatches across reads.
Note that the “MD” tag must exist in BAM file.
- Options:
- --version
show program’s version number and exit
- -h, --help
show this help message and exit
- -i INPUT_BAM, --input=INPUT_BAM
Input BAM file. [required]
- -l READ_ALIGNMENT_LENGTH, --read-align-length=READ_ALIGNMENT_LENGTH
Alignment length of read. It is usually set to the orignial read length. For example, all these cigar strings (“101M”, “68M140N33M”, “53M1D48M”) suggest the read alignment length is 101. [required]
- -o OUTPUT_PREFIX, --out-prefix=OUTPUT_PREFIX
Prefix of output files(s). [required]
- -n READ_NUMBER, --read-num=READ_NUMBER
Number of aligned reads with mismatches used to calculate the mismatch profile. default=1000000
- -q MAP_QUAL, --mapq=MAP_QUAL
Minimum mapping quality. default=30
Example:
$ python2.7 mismatch_profile.py -l 101 -i ../test.bam -o out

$ ls -l out.mismatch_profile.* |awk '{print $9}'
out.mismatch_profile.pdf
out.mismatch_profile.r
out.mismatch_profile.xls
normalize_bigwig.py
Visualizing is the most straightforward and effective way to QC your RNA-seq data. For example, differential expression can be easily checked by comparing two RNA-seq tracks using genome browser. However, one must make sure that all samples are comparable before “visual checking”. Signal values in wig (or bigwig) file are contributed form two factors: 1) total read number. 2) read length. Therefore, only normalized to ‘total read count’ is problematic if read length is different between samples. Here we normalize every bigwig file into the same wigsum. wigsum is the summary of signal value across the genome. for example, wigsum = 100,000,000 equals to the coverage achieved by 1 million 100nt long reads or 2 million 50nt long reads.
- Options:
- --version
show program’s version number and exit
- -h, --help
show this help message and exit
- -i BIGWIG_FILE, --bwfile=BIGWIG_FILE
Input BigWig file. [required]
- -o OUTPUT_WIG, --output=OUTPUT_WIG
Output wig file. [required]
- -s CHROMSIZE, --chromSize=CHROMSIZE
Chromosome size file. Tab or space separated text file with 2 columns: first column is chromosome name, second column is size of the chromosome. [required]
- -t TOTAL_WIGSUM, --wigsum=TOTAL_WIGSUM
Specified wigsum. 100000000 equals to coverage of 1 million 100nt reads. default=100000000 [optional]
- -r REFGENE_BED, --refgene=REFGENE_BED
Reference gene model in bed format. [optional]
- -c CHUNK_SIZE, --chunk=CHUNK_SIZE
Chromosome chunk size. Each chomosome will be cut into samll chunks of this size. Decrease chunk size will save more RAM. default=500000 (bp) [optional]
- -f OUT_FORMAT, --format=OUT_FORMAT
Output format. either “wig” or “bgr”. “bgr” save disk space but make program slower. default=bgr
Note: From RSeQC v3.0.0, the option ‘-s’ was removed. The chromSizes can be calculated from the header section of biwig file(s) using pyBigWig.
overlay_bigwig.py
This module allow users to manipulate two BigWig files.
- Options:
- --version
show program’s version number and exit
- -h, --help
show this help message and exit
- -i BIGWIG_FILE1, --bwfile1=BIGWIG_FILE1
One BigWig file
- -j BIGWIG_FILE2, --bwfile2=BIGWIG_FILE2
Another BigWig file
- -a ACTION, --action=ACTION
After pairwise align two bigwig files, perform the follow actions (Only select one keyword):”Add” = add signals. “Average” = average signals. “Division”= divide bigwig2 from bigwig1. Add 1 to both bigwig. “Max” = pick the signal that is larger. “Min” = pick the signal that is smaller. “Product” = multiply signals. “Subtract” = subtract signals in 2nd bigwig file from the corresponiding ones in the 1st bigwig file. “geometricMean” = take the geometric mean of signals.
- -o OUTPUT_WIG, --output=OUTPUT_WIG
Output wig file
- -s CHROMSIZE, --chromSize=CHROMSIZE
Chromosome size file. Tab or space separated text file with 2 columns: first column is chromosome name, second column is size of the chromosome.
- -c CHUNK_SIZE, --chunk=CHUNK_SIZE
Chromosome chunk size. Each chomosome will be cut into samll chunks of this size. Decrease chunk size will save more RAM. default=100000 (bp)
- -m MIN_SCORE, --min_signal=MIN_SCORE
To redude the size of output wigfile, genomic positions with signal value smaller than (<) this threshold will be filtered out. default=0.0
Note: From RSeQC v3.0.0, the option ‘-s’ was removed. The chromSizes can be calculated from the header section of biwig file(s) using pyBigWig.
read_distribution.py
Provided a BAM/SAM file and reference gene model, this module will calculate how mapped reads were distributed over genome feature (like CDS exon, 5’UTR exon, 3’ UTR exon, Intron, Intergenic regions). When genome features are overlapped (e.g. a region could be annotated as both exon and intron by two different transcripts) , they are prioritize as: CDS exons > UTR exons > Introns > Intergenic regions, for example, if a read was mapped to both CDS exon and intron, it will be assigned to CDS exons.
“Total Reads”: This does NOT include those QC fail,duplicate and non-primary hit reads
“Total Tags”: reads spliced once will be counted as 2 tags, reads spliced twice will be counted as 3 tags, etc. And because of this, “Total Tags” >= “Total Reads”
“Total Assigned Tags”: number of tags that can be unambiguously assigned the 10 groups (see below table).
Tags assigned to “TSS_up_1kb” were also assigned to “TSS_up_5kb” and “TSS_up_10kb”, tags assigned to “TSS_up_5kb” were also assigned to “TSS_up_10kb”. Therefore, “Total Assigned Tags” = CDS_Exons + 5’UTR_Exons + 3’UTR_Exons + Introns + TSS_up_10kb + TES_down_10kb.
When assign tags to genome features, each tag is represented by its middle point.
RSeQC cannot assign those reads that:
hit to intergenic regions that beyond region starting from TSS upstream 10Kb to TES downstream 10Kb.
hit to regions covered by both 5’UTR and 3’ UTR. This is possible when two head-to-tail transcripts are overlapped in UTR regions.
hit to regions covered by both TSS upstream 10Kb and TES downstream 10Kb.
- Options:
- --version
show program’s version number and exit
- -h, --help
show this help message and exit
- -i INPUT_FILE, --input-file=INPUT_FILE
Alignment file in BAM or SAM format.
- -r REF_GENE_MODEL, --refgene=REF_GENE_MODEL
Reference gene model in bed format.
Example:
read_distribution.py -i Pairend_StrandSpecific_51mer_Human_hg19.bam -r hg19.refseq.bed12
Output:
Group |
Total_bases |
Tag_count |
Tags/Kb |
|---|---|---|---|
CDS_Exons |
33302033 |
20002271 |
600.63 |
5’UTR_Exons |
21717577 |
4408991 |
203.01 |
3’UTR_Exons |
15347845 |
3643326 |
237.38 |
Introns |
1132597354 |
6325392 |
5.58 |
TSS_up_1kb |
17957047 |
215331 |
11.99 |
TSS_up_5kb |
81621382 |
392296 |
4.81 |
TSS_up_10kb |
149730983 |
769231 |
5.14 |
TES_down_1kb |
18298543 |
266161 |
14.55 |
TES_down_5kb |
78900674 |
729997 |
9.25 |
TES_down_10kb |
140361190 |
896882 |
6.39 |
read_duplication.py
Two strategies were used to determine reads duplication rate: * Sequence based: reads with identical sequence are regarded as duplicated reads. * Mapping based: reads mapped to the exactly same genomic location are regarded as duplicated reads. For splice reads, reads mapped to the same starting position and splice the same way are regarded as duplicated reads.
- Options:
- --version
show program’s version number and exit
- -h, --help
show this help message and exit
- -i INPUT_FILE, --input-file=INPUT_FILE
Alignment file in BAM or SAM format.
- -o OUTPUT_PREFIX, --out-prefix=OUTPUT_PREFIX
Prefix of output files(s).
- -u UPPER_LIMIT, --up-limit=UPPER_LIMIT
Upper limit of reads’ occurrence. Only used for plotting, default=500 (times)
- -q MAP_QUAL, --mapq=MAP_QUAL
Minimum mapping quality (phred scaled) for an alignment to be considered as “uniquely mapped”. default=30
Example:
read_duplication.py -i Pairend_nonStrandSpecific_36mer_Human_hg19.bam -o output
Output:
output.dup.pos.DupRate.xls: Read duplication rate determined from mapping position of read. First column is “occurrence” or duplication times, second column is number of uniquely mapped reads.
output.dup.seq.DupRate.xls: Read duplication rate determined from sequence of read. First column is “occurrence” or duplication times, second column is number of uniquely mapped reads.
output.DupRate_plot.r: R script to generate pdf file
output.DupRate_plot.pdf: graphical output generated from R scrip

read_GC.py
GC content distribution of reads. Options:
- --version
show program’s version number and exit
- -h, --help
show this help message and exit
- -i INPUT_FILE, --input-file=INPUT_FILE
Alignment file in BAM or SAM format.
- -o OUTPUT_PREFIX, --out-prefix=OUTPUT_PREFIX
Prefix of output files(s).
- -q MAP_QUAL, --mapq=MAP_QUAL
Minimum mapping quality (phred scaled) for an alignment to be called “uniquely mapped”. default=30
Example:
read_GC.py -i Pairend_nonStrandSpecific_36mer_Human_hg19.bam -o output
Output:
output.GC.xls: Two column, plain text file, first column is GC%, second column is read count
output.GC_plot.r: R script to generate pdf file.
output.GC_plot.pdf: graphical output generated from R script.

read_hexamer.py
calculate hexamer (6mer) frequency. If ‘-r’ was specified, hexamer frequency was also calculated for the reference genome. If ‘-g’ was provided, hexamer frequency was also calculated for the mRNA sequences.
- Options:
- --version
show program’s version number and exit
- -h, --help
show this help message and exit
- -i INPUT_READ, --input=INPUT_READ
Read sequence in fasta or fastq format. Multiple fasta/fastq files should be separated by ‘,’. For example: read.fq,read2.fa,read3,fa
- -r REF_GENOME, --refgenome=REF_GENOME
Reference genome sequence in fasta format. Optional
- -g REF_GENE, --refgene=REF_GENE
Reference mRNA sequence in fasta format. Optional
read_NVC.py
This module is used to check the nucleotide composition bias. Due to random priming, certain patterns are over represented at the beginning (5’end) of reads. This bias could be easily examined by NVC (Nucleotide versus cycle) plot. NVC plot is generated by overlaying all reads together, then calculating nucleotide composition for each position of read (or each sequencing cycle). In ideal condition (genome is random and RNA-seq reads is randomly sampled from genome), we expect A%=C%=G%=T%=25% at each position of reads.
NOTE: this program expect a fixed read length
- Options:
- --version
show program’s version number and exit
- -h, --help
show this help message and exit
- -i INPUT_FILE, --input-file=INPUT_FILE
Input file in BAM or SAM format.[required]
- -o OUTPUT_PREFIX, --out-prefix=OUTPUT_PREFIX
Prefix of output files(s). [required]
- -x, --nx
Flag option. Presense of this flag tells program to include N,X in output NVC plot [required]
- -q MAP_QUAL, --mapq=MAP_QUAL
Minimum mapping quality (phred scaled) for an alignment to be called “uniquely mapped”. default=30
Example:
read_NVC.py -i Pairend_nonStrandSpecific_36mer_Human_hg19.bam -o output
Output:

read_quality.py
According to SAM specification, if Q is the character to represent “base calling quality” in SAM file, then Phred Quality Score = ord(Q) - 33. Here ord() is python function that returns an integer representing the Unicode code point of the character when the argument is a unicode object, for example, ord(‘a’) returns 97. Phred quality score is widely used to measure “reliability” of base-calling, for example, phred quality score of 20 means there is 1/100 chance that the base-calling is wrong, phred quality score of 30 means there is 1/1000 chance that the base-calling is wrong. In general: Phred quality score = -10xlog(10)P, here P is probability that base-calling is wrong.
- Options:
- --version
show program’s version number and exit
- -h, --help
show this help message and exit
- -i INPUT_FILE, --input-file=INPUT_FILE
Alignment file in BAM or SAM format. [required]
- -o OUTPUT_PREFIX, --out-prefix=OUTPUT_PREFIX
Prefix of output files(s). [required]
- -r REDUCE_FOLD, --reduce=REDUCE_FOLD
To avoid making huge vector in R, nucleotide with particular phred score less frequent than this number will be ignored. Increase this number save more memory while reduce precision. Set to 1 achieve maximum precision (i.e. every nucleotide will be considered). This option only applies to the ‘boxplot’. default=1000
- -q MAP_QUAL, --mapq=MAP_QUAL
Minimum mapping quality (phred scaled) for an alignment to be called “uniquely mapped”. default=30
Example:
read_quality.py -i Pairend_nonStrandSpecific_36mer_Human_hg19.bam -o output
Output:
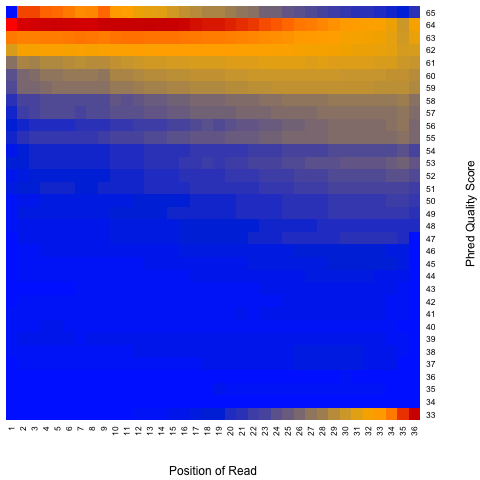
Heatmap: use different color to represent nucleotide density (“blue”=low density,”orange”=median density,”red”=high density”)
sc_bamStat.py -h
This program reports single cell RNA-seq (scRNA-seq) reads mapping statistics. It needs the BAM file generated by the Cell Ranger workflow.
- Options:
- --version
show program’s version number and exit
- -h, --help
show this help message and exit
- -i BAM_FILE, --infile=BAM_FILE
Input file in BAM foramt. Must have BAM alignment tags indicated below.
- --cb-tag=CB_TAG
BAM alignment tag. Used to indicate error-corrected cellular barcode. default=’CB’
- --re-tag=RE_TAG
BAM alignment tag. Used to indicate the region type of the alignment (E = exonic, N = intronic, I = intergenic). default=’RE’
- --tx-tag=TX_TAG
BAM alignment tag. Used to indicate reads aligned to the same strand as the annotated transcripts. default=’TX’
- --an-tag=AN_TAG
BAM alignment tag. Used to indicate reads aligned to the antisense strand of the annotated transcripts. default=’AN’
- --umi-tag=UMI_TAG
BAM alignment tag. Used to indicat the error-corrected UMI. default=’UB’
- --xf-tag=XF_TAG
BAM alignment tag. Used to indicate reads confidently mapped to the feature. default=’xf’
- --chrM-id=MIT_CONTIG_NAME
The name of mitochondrial chromosome in BAM file. default=’chrM’
- --verbose
Logical to determine if detailed running information is printed to screen.
Example (the test BAM file can be downloaded from here):
$ sc_bamStat.py -i possorted_genome_bam.bam
2022-10-14 08:54:01 [INFO]  Reading BAM file "possorted_genome_bam.bam" ...
2022-10-14 08:54:01 [INFO]  Processing "chr21.part" ...
2022-10-14 08:54:03 [INFO]  Processed 248429 alignments from "chr21.part"
2022-10-14 08:54:04 [INFO]  Processing "chrM" ...
2022-10-14 08:54:04 [INFO]  Processed 32 alignments from "chrM"
2022-10-14 08:54:04 [INFO]  Processing "GL000220.1" ...
2022-10-14 08:54:04 [INFO]  Processed 47671 alignments from "GL000220.1"
2022-10-14 08:54:04 [INFO]  Processing total 296132 alignments mapped to all chromosomes.
2022-10-14 08:54:04 [INFO]  Count total mapped reads ...
2022-10-14 08:54:05 [INFO]  Count confidently mapped reads ...
2022-10-14 08:54:05 [INFO]  Removing intermediate files ...


Total_alignments: 296132
└--Confident_alignments: 95920

Total_mapped_reads: 296132
|--Non_confidently_mapped_reads:  200212  (67.61%)
└--Confidently_mapped_reads:  95920 (32.39%)
   |--Reads_with_PCR_duplicates:  65011 (67.78%)
   └--Reads_no_PCR_duplicates:  30909 (32.22%)

   |--Reads_map_to_forward(Waston)_strand:  36475 (38.03%)
   └--Reads_map_to_Reverse(Crick)_strand: 59445 (61.97%)

   |--Reads_map_to_sense_strand:  95920 (100.00%)
   └--Reads_map_to_antisense_strand:  0 (0.00%)
   └--Other:  0 (0.00%)

   |--Reads_map_to_exons: 95920 (100.00%)
   └--Reads_map_to_introns: 0 (0.00%)
   └--Reads_map_to_intergenic:  0 (0.00%)
   └--Other:  0 (0.00%)

   |--Reads_with_error-corrected_barcode: 94049 (98.05%)
   └--Reads_no_error-corrected_barcode: 1871  (1.95%)

   |--Reads_with_error-corrected_UMI: 95854 (99.93%)
   └--Reads_no_error-corrected_UMI: 66  (0.07%)

   |--Reads_map_to_mitochonrial_genome: 0 (0.00%)
   └--Reads_map_to_nuclear_genome:  95920 (100.00%)

   |--Map_consecutively:  76543 (79.80%)
   |--Map_with_clipping:  8018  (8.36%)
   |--Map_with_splicing:  8744  (9.12%)
   |--Map_with_splicing_and_clipping: 516 (0.54%)
   └--Others: 2099  (2.19%)

2022-10-14 08:54:05 [INFO]  Done.
sc_seqLogo.py -h
This program generates a DNA sequence logo from FASTA or FASTQ format file. It is useful to visualize the nucleotide compositions of “sample barcode”, “cell barcode” and UMI (Unique molecular identifier).
After running the cellranger mkfastq (link), we will get three types of FASTQ files from 10X Single Cell 3’ Library:
I1 fastq file. This files contains the 8 bp sample barcodes. Sample barcode is used to demultiplexing (i.e., sort sequenced reads into separate files for different samples that were pooled together during sequencing).
R1 fastq file. This file contains 26 bp sequences (16 bp cell barcode + 10 bp UMI). Note, Chromium Single Cell 3’ Solution V3 use 12 bp UMI.
R2 fastq file. This file contains the actual cDNA reads which can be mapped to the transcriptome.
- Options:
- --version
show program’s version number and exit
- -h, --help
show this help message and exit
- -i IN_FILE, --infile=IN_FILE
Input DNA sequence file in FASTQ, FASTA or pure sequence format (i.e., each DNA sequence per row). All sequences must be the same length. This file can be plain text or compressed format (“.gz”, “.Z”,”.z”,”.bz”, “.bz2”, “.bzip2”).
- -o OUT_FILE, --outfile=OUT_FILE
The prefix of output files.
- --iformat=IN_FORMAT
The format of input file. Must be ‘fq’ or ‘fa’. default=’fq’
- --oformat=OUT_FORMAT
The format of output logo file. Must be ‘pdf’, ‘png’ or ‘svg’. default=’pdf’
- -n MAX_SEQ, --nseq-limit=MAX_SEQ
Only process this many sequences and stop. default=none (generate logo fromALL sequences).
- --font-name=FONT_NAME
The font of logo characters. For a list of valid font names, run logomaker.list_font_names().default=’sans’
- --stack-order=STACK_ORDER
Must be ‘big_on_top’, ‘small_on_top’, or ‘fixed’. ‘big_on_top’ : nucleotide with the highestfrequency will be on the top; ‘small_on_top’ : nucleotide with the lowest frequency will be on thetop; ‘fixed’ : nucleotides from top to bottom are in the same order as characters appear in thedata frame. default=’big_on_top’
- --flip-below
If set, characters below the X-axis (which correspond to negative values in the matrix)will be flipped upside down. default=False
- --shade-below=SHADE_BELOW
The amount of shading to use for characters drawn below the X-axis. 0 <= shade_below <= 1.Larger values correspond to more shading. default=0.0
- --fade-below=FADE_BELOW
The amount of fading to use for characters drawn below the X-axis. 0 <= shade_below <= 1. Larger values correspond to more fading. default=0.0
- --excludeN
If set, exclude all DNA sequences containing “N”.
- --highlight-start=HI_START
Highlight logo from this position. Must be within [0, sequence_length-1].default=none (no highlight)
- --highlight-end=HI_END
Highlight logo to this position. Must be within [0, len(logo)-1].default=none (no highlight)
- --verbose
If set, print detailed information for debugging.
Example-1: generate sequence logo for read-1. The test fastq file is available from here:
$ sc_seqLogo.py -i test_sample_S1_L001_R1_001.fastq.gz  --highlight-start=0 --highlight-end=15 -o output_R1

2022-10-14 09:37:20 [INFO]  Reading FASTQ file "test_sample_S1_L001_R1_001.fastq.gz" ...
2022-10-14 09:37:20 [INFO]  88 sequences finished
2022-10-14 09:37:20 [INFO]  Make data frame from dict of dict ...
2022-10-14 09:37:20 [INFO]  Filling NA as zero ...
2022-10-14 09:37:20 [INFO]  Making logo ...
2022-10-14 09:37:20 [INFO]  'N' will be kept.
2022-10-14 09:37:20 [INFO]  Mean-centered logo saved to "output_R1.logo_mean_centered.pdf".
2022-10-14 09:37:20 [INFO]  Highlight logo from 0 to 15
2022-10-14 09:37:20 [INFO]  Logo saved to "output_R1.logo.pdf".
Sequence logo for read_1 (cell barcode + UMI). The first 16 nt (cell barcode) are highlighted.
Sequence logo (mean-centered) for read_1 (cell barcode + UMI). The first 16 nt (cell barcode) are highlighted.
Example-2: generate sequence logo for sample barcode. The test fastq file is available from here:
$ sc_seqLogo.py -i test_sample_S1_L001_I1_001.fastq.gz -o output_I1

2022-10-14 09:54:07 [INFO]  Reading FASTQ file "test_sample_S1_L001_I1_001.fastq.gz" ...
2022-10-14 09:54:07 [INFO]  88 sequences finished
2022-10-14 09:54:07 [INFO]  Make data frame from dict of dict ...
2022-10-14 09:54:07 [INFO]  Filling NA as zero ...
2022-10-14 09:54:07 [INFO]  Making logo ...
2022-10-14 09:54:07 [INFO]  'N' will be kept.
2022-10-14 09:54:07 [INFO]  Mean-centered logo saved to "output_I1.logo_mean_centered.pdf".
2022-10-14 09:54:08 [INFO]  Logo saved to "output_I1.logo.pdf".
Sequence logo for 8nt sample barcode.
Sequence logo (mean-centered) for 8nt sample barcode.
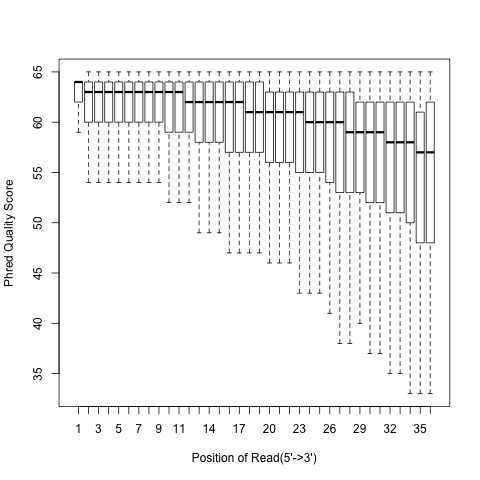
sc_seqQual.py
This program generates heatmap from a FASTQ file to visualize the sequencing quality.
Note
This function requires the pheatmap R package.
- Options:
- --version
show program’s version number and exit
- -h, --help
show this help message and exit
- -i IN_FILE, --infile=IN_FILE
Input file in FASTQ (https://en.wikipedia.org/wiki/FASTQ_format#) format.
- -o OUT_FILE, --outfile=OUT_FILE
The prefix of output files.
- -n MAX_SEQ, --nseq-limit=MAX_SEQ
Only process this many sequences and stop. default=none (generate logo from ALL sequences).
- --cell-width=CELL_WIDTH
Cell width (in points) of the heatmap. default=12
- --cell-height=CELL_HEIGHT
Cell height (in points) of the heatmap. default=10
- --font-size=FONT_SIZE
Font size in points. If –display-num was set, fontsize_number = 0.8 * font_size. default=6
- --angle=COL_ANGLE
The angle (must be 0, 45, 90, 270, 315) of column text lables under the heatmap. default=45
- --text-color=TEXT_COLOR
The color of numbers in each cell. default=black
- --file-type=FILE_TYPE
The file type of heatmap. Choose one of ‘pdf’, ‘png’, ‘tiff’, ‘bmp’, ‘jpeg’. default=pdf
- --no-num
if set, will not print numerical values to cells. default=False
- --verbose
If set, will produce detailed information for debugging.
Example: generate the heatmap of R2 sequencing quality. The test fastq file is available from here:
$ sc_seqQual.py -i test_sample_S1_L001_R2_001.fastq.gz -o R2_qual
2022-10-16 05:40:00 [INFO]  Reading FASTQ file "test_sample_S1_L001_R2_001.fastq.gz" ...
2022-10-16 05:40:00 [INFO]  88 quality sequences finished
2022-10-16 05:40:00 [INFO]  Make data frame from dict of dict ...
2022-10-16 05:40:00 [INFO]  Filling NA as zero ...
2022-10-16 05:40:00 [INFO]  Note: NumExpr detected 16 cores but "NUMEXPR_MAX_THREADS" not set, so enforcing safe limit of 8.
2022-10-16 05:40:00 [INFO]  NumExpr defaulting to 8 threads.
2022-10-16 05:40:00 [INFO]  Writing R code to "R2_qual.qual_heatmap.r"
2022-10-16 05:40:00 [INFO]  Displayed numerical values on heatmap
2022-10-16 05:40:00 [INFO]  Running R script file "R2_qual.qual_heatmap.r"
Loading required package: pheatmap
In this heatmap, the X-aixs represents the nucleotide position of read, the Y-aixs represents quality score, and color represents frequencies (“percent of reads”).

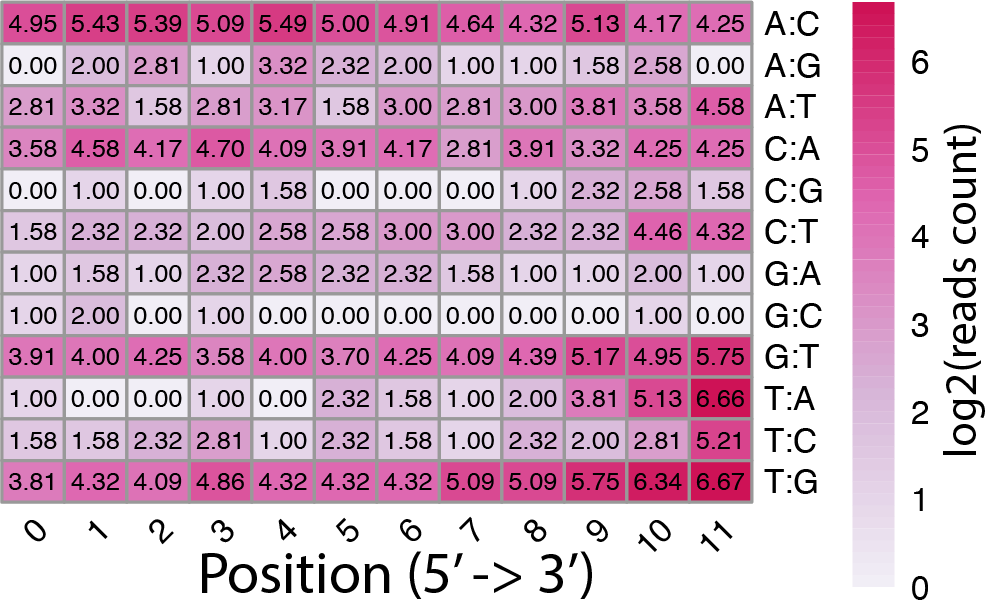
sc_editMatrix.py
Barcodes from read-1 are not always the same as those in the whilte list. Cell Ranger use algorithems to correct putative barcode sequences against the whitelist. This program generates heatmaps to visualize where are those corrections (i.e., the X-axis), type of corrections (Y-axis, such as “C” to “T”) and frequencies of corrections (color) of the cell barcodes and UMIs.
Note
This function requires the pheatmap R package.
- Options:
- --version
show program’s version number and exit
- -h, --help
show this help message and exit
- -i IN_FILE, --infile=IN_FILE
Input file in BAM foramt.
- -o OUT_FILE, --outfile=OUT_FILE
The prefix of output files.
- --limit=READS_NUM
Number of alignments to process. default=none
- --cr-tag=CR_TAG
Tag of cellular barcode reported by the sequencer in BAM file. default=’CR’
- --cb-tag=CB_TAG
Tag of error-corrected cellular barcode in BAM file. default=’CB’
- --ur-tag=UR_TAG
Tag of UMI reported by the sequencer in BAM file. default=’UR’
- --ub-tag=UB_TAG
Tag of error-corrected UMI in BAM file. default=’UB’
- --cell-width=CELL_WIDTH
Points of cell width in the heatmap. default=15
- --cell-height=CELL_HEIGHT
Points of cell height in the heatmap. default=10
- --font-size=FONT_SIZE
Font size. If –display-num was set, fontsize_number = 0.8 * font_size. default=8
- --angle=COL_ANGLE
The angle (must be 0, 45, 90, 270, 315) of column text lables under the heatmap. default=45
- --text-color=TEXT_COLOR
The color of numbers in each cell. default=black
- --file-type=FILE_TYPE
The file type of heatmap. Choose one of ‘pdf’, ‘png’, ‘tiff’, ‘bmp’, ‘jpeg’. default=pdf
- --verbose
If set, detailed running information is printed to screen.
- --no-num
If set, will not print numerical values to cells. default=False
Example:
$ sc_editMatrix.py -i possorted_genome_bam.bam -o output

2022-10-16 06:14:59 [INFO]  Reading BAM file "possorted_genome_bam.bam" ...
2022-10-16 06:15:02 [INFO]  Total alignments processed: 461084
2022-10-16 06:15:02 [INFO]  Number of alignmenets with <cell barcode> kept AS IS: 426239
2022-10-16 06:15:02 [INFO]  Number of alignmenets with <cell barcode> edited: 10928
2022-10-16 06:15:02 [INFO]  Number of alignmenets with <cell barcode> missing: 23916
2022-10-16 06:15:02 [INFO]  Number of alignmenets with UMI kept AS IS: 459003
2022-10-16 06:15:02 [INFO]  Number of alignmenets with UMI edited: 1741
2022-10-16 06:15:02 [INFO]  Number of alignmenets with UMI missing: 339
2022-10-16 06:15:02 [INFO]  Writing cell barcode frequencies to "output.CB_freq.tsv"
2022-10-16 06:15:02 [INFO]  Writing UMI frequencies to "output.UMI_freq.tsv"
2022-10-16 06:15:02 [INFO]  Writing the nucleotide editing matrix (count) of cell barcode to "output.CB_edits_count.csv"
2022-10-16 06:15:02 [INFO]  Writing the nucleotide editing matrix of molecular barcode (UMI) to "output.UMI_edits_count.csv"
2022-10-16 06:15:02 [INFO]  Writing R code to "output.CB_edits_heatmap.r"
2022-10-16 06:15:02 [INFO]  Displayed numerical values on heatmap
2022-10-16 06:15:02 [INFO]  Numbers will be displayed on log2 scale
2022-10-16 06:15:02 [INFO]  Running R script file "output.CB_edits_heatmap.r"
Loading required package: pheatmap
2022-10-16 06:15:03 [INFO]  Writing R code to "output.UMI_edits_heatmap.r"
2022-10-16 06:15:03 [INFO]  Displayed numerical values on heatmap
2022-10-16 06:15:03 [INFO]  Numbers will be displayed on log2 scale
2022-10-16 06:15:03 [INFO]  Running R script file "output.UMI_edits_heatmap.r"
Loading required package: pheatmap
Two heatmaps were generated.
Cell barcode
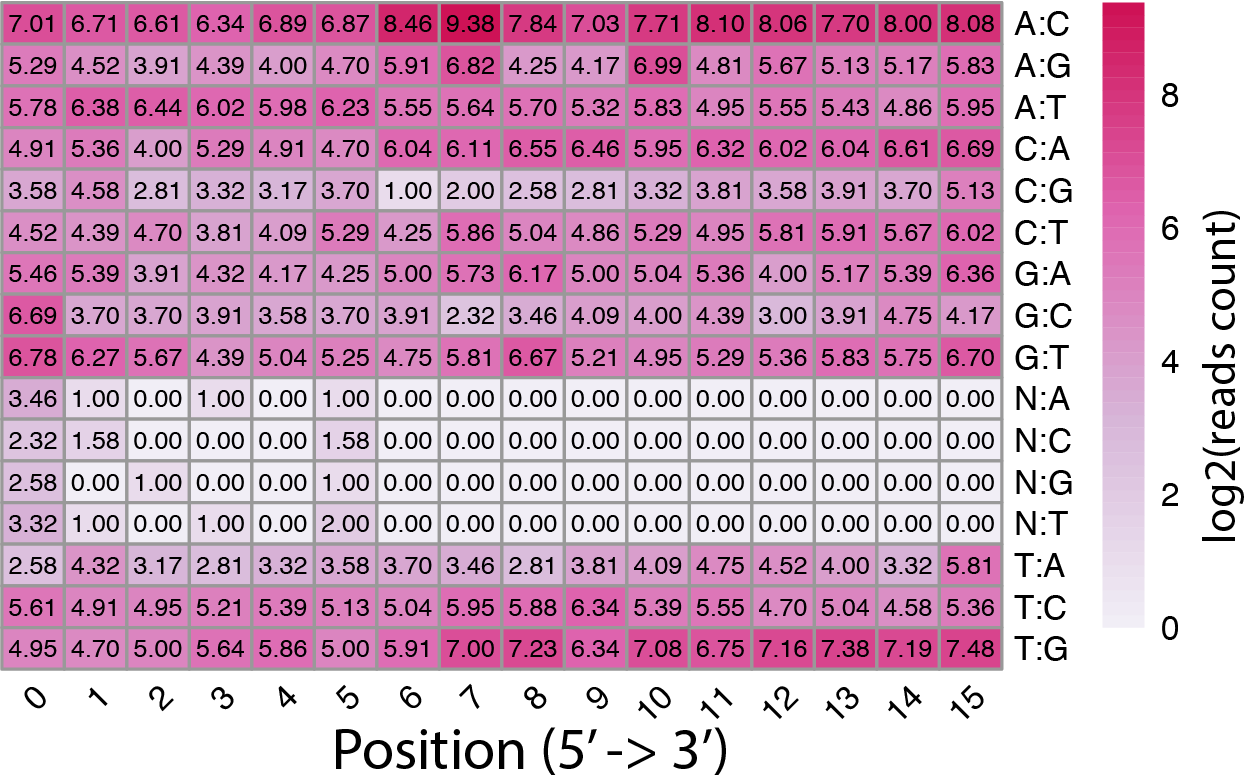
UMI
RNA_fragment_size.py
Calculate fragment size for each gene/transcript. For each transcript, it will report : 1) Number of fragment that was used to estimate mean, median, std (see below). 2) mean of fragment size 3) median of fragment size 4) stdev of fragment size
- Options:
- --version
show program’s version number and exit
- -h, --help
show this help message and exit
- -i INPUT_FILE, --input=INPUT_FILE
Input BAM file
- -r REFGENE_BED, --refgene=REFGENE_BED
Reference gene model in BED format. Must be strandard 12-column BED file. [required]
- -q MAP_QUAL, --mapq=MAP_QUAL
Minimum mapping quality (phred scaled) for an alignment to be called “uniquely mapped”. default=30
- -n FRAGMENT_NUM, --frag-num=FRAGMENT_NUM
Minimum number of fragment. default=3
Example:
$ python2.7 RNA_fragment_size.py -r hg19.RefSeq.union.bed -i SRR873822_RIN10.bam > SRR873822_RIN10.fragSize
$ head -4 SRR873822_RIN10.fragSize
chrom  tx_start        tx_end  symbol  frag_count      frag_mean       frag_median     frag_std
chr10  101542354       101611949       ABCC2   87      210.103448276   177.0   110.746789423
chr10  124768428       124817806       ACADSB  769     186.657997399   160.0   87.9515992717
chr10  114133915       114188138       ACSL5   122     183.475409836   157.5   85.1940132118
RPKM_count.py
Note
This has been replaced by FPKM_count.py
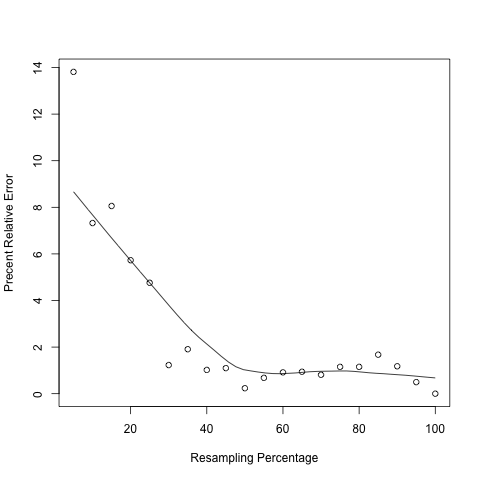
RPKM_saturation.py
The precision of any sample statitics (RPKM) is affected by sample size (sequencing depth); “resampling” or “jackknifing” is a method to estimate the precision of sample statistics by using subsets of available data. This module will resample a series of subsets from total RNA reads and then calculate RPKM value using each subset. By doing this we are able to check if the current sequencing depth was saturated or not (or if the RPKM values were stable or not) in terms of genes’ expression estimation. If sequencing depth was saturated, the estimated RPKM value will be stationary or reproducible. By default, this module will calculate 20 RPKM values (using 5%, 10%, … , 95%,100% of total reads) for each transcripts.
In the output figure, Y axis is “Percent Relative Error” or “Percent Error” which is used to measures how the RPKM estimated from subset of reads (i.e. RPKMobs) deviates from real expression level (i.e. RPKMreal). However, in practice one cannot know the RPKMreal. As a proxy, we use the RPKM estimated from total reads to approximate RPKMreal.

- Options:
- --version
show program’s version number and exit
- -h, --help
show this help message and exit
- -i INPUT_FILE, --input-file=INPUT_FILE
Alignment file in BAM or SAM format. [required]
- -o OUTPUT_PREFIX, --out-prefix=OUTPUT_PREFIX
Prefix of output files(s). [required]
- -r REFGENE_BED, --refgene=REFGENE_BED
Reference gene model in bed fomat. [required]
- -d STRAND_RULE, --strand=STRAND_RULE
How read(s) were stranded during sequencing. For example: –strand=’1++,1–,2+-,2-+’ means that this is a pair-end, strand-specific RNA-seq, and the strand rule is: read1 mapped to ‘+’ => parental gene on ‘+’; read1 mapped to ‘-’ => parental gene on ‘-’; read2 mapped to ‘+’ => parental gene on ‘-’; read2 mapped to ‘-’ => parental gene on ‘+’. If you are not sure about the strand rule, run ‘infer_experiment.py’ default=none (Not a strand specific RNA-seq data)
- -l PERCENTILE_LOW_BOUND, --percentile-floor=PERCENTILE_LOW_BOUND
Sampling starts from this percentile. A integer between 0 and 100. default=5
- -u PERCENTILE_UP_BOUND, --percentile-ceiling=PERCENTILE_UP_BOUND
Sampling ends at this percentile. A integer between 0 and 100. default=100
- -s PERCENTILE_STEP, --percentile-step=PERCENTILE_STEP
Sampling frequency. Smaller value means more sampling times. A integer between 0 and 100. default=5
- -c RPKM_CUTOFF, --rpkm-cutoff=RPKM_CUTOFF
Transcripts with RPKM smaller than this number will be ignored in visualization plot. default=0.01
- -q MAP_QUAL, --mapq=MAP_QUAL
Minimum mapping quality (phred scaled) for an alignment to be called “uniquely mapped”. default=30
Example:
RPKM_saturation.py -r hg19.refseq.bed12 -d '1++,1--,2+-,2-+' -i Pairend_StrandSpecific_51mer_Human_hg19.bam -o output
Output:
output..eRPKM.xls: RPKM values for each transcript
output.rawCount.xls: Raw count for each transcript
output.saturation.r: R script to generate plot
output.saturation.pdf:

All transcripts were sorted in ascending order according to expression level (RPKM). Then they are divided into 4 groups:
Q1 (0-25%): Transcripts with expression level ranked below 25 percentile.
Q2 (25-50%): Transcripts with expression level ranked between 25 percentile and 50 percentile.
Q3 (50-75%): Transcripts with expression level ranked between 50 percentile and 75 percentile.
Q4 (75-100%): Transcripts with expression level ranked above 75 percentile.
BAM/SAM file containing more than 100 million alignments will make module very slow. Follow example below to visualize a particular transcript (using R console):
pdf("xxx.pdf")     #starts the graphics device driver for producing PDF graphics
x <- seq(5,100,5)  #resampling percentage (5,10,15,...,100)
rpkm <- c(32.95,35.43,35.15,36.04,36.41,37.76,38.96,38.62,37.81,38.14,37.97,38.58,38.59,38.54,38.67, 38.67,38.87,38.68,  38.42,  38.23)  #Paste RPKM values calculated from each subsets
scatter.smooth(x,100*abs(rpkm-rpkm[length(rpkm)])/(rpkm[length(rpkm)]),type="p",ylab="Precent Relative Error",xlab="Resampling Percentage")
dev.off()          #close graphical device
spilt_bam.py
Provide gene list (bed) and BAM file, this module will split the original BAM file into 3 small BAM files:
*.in.bam: reads that are mapped to exon regions of the gene list (or reads consumed by gene list).
*.ex.bam: reads that cannot be mapped the exon regions of the original gene list.
*.junk.bam: qcfailed reads or unmapped reads.
It is particular useful if the input gene list is ribosomal RNA, in this situation, user can estimate how many reads are originated from ribosomal RNA. Download rRNA
- Options:
- --version
show program’s version number and exit
- -h, --help
show this help message and exit
- -i INPUT_FILE, --input-file=INPUT_FILE
Alignment file in BAM or SAM format. BAM file should be sorted and indexed.
- -r GENE_LIST, --genelist=GENE_LIST
Gene list in bed foramt. All reads hits to exon regions (defined by this gene list) will be saved into one BAM file, the remaining reads will saved into another BAM file.
- -o OUTPUT_PREFIX, --out-prefix=OUTPUT_PREFIX
Prefix of output BAM files. “prefix.in.bam” file contains reads mapped to the gene list specified by “-r”, “prefix.ex.bam” contains reads that cannot mapped to gene list. “prefix.junk.bam” contains qcfailed or unmapped reads.
Example:
python2.7  split_bam.py -i Pairend_StrandSpecific_51mer_Human_hg19.bam  -r hg19.rRNA.bed -o output

#Output

Total records:                                         44826454
output.in.bam (Reads consumed by input gene list):        5185
output.ex.bam (Reads not consumed by input gene list):    44821269
output.junk.bam (qcfailed, unmapped reads):                 0
split_paired_bam.py
Split bam file (pair-end) into 2 single-end bam file
- Options:
- --version
show program’s version number and exit
- -h, --help
show this help message and exit
- -i INPUT_FILE, --input-file=INPUT_FILE
Alignment file in BAM or SAM format. BAM file should be sorted and indexed
- -o OUTPUT_PREFIX, --out-prefix=OUTPUT_PREFIX
Prefix of output BAM files. “prefix.R1.bam” file contains the 1st read, “prefix.R2.bam” file contains the 2nd read
tin.py
This program is designed to evaluate RNA integrity at transcript level. TIN (transcript integrity number) is named in analogous to RIN (RNA integrity number). RIN (RNA integrity number) is the most widely used metric to evaluate RNA integrity at sample (or transcriptome) level. It is a very useful preventive measure to ensure good RNA quality and robust, reproducible RNA sequencing. However, it has several weaknesses:
RIN score (1 <= RIN <= 10) is not a direct measurement of mRNA quality. RIN score heavily relies on the amount of 18S and 28S ribosome RNAs, which was demonstrated by the four features used by the RIN algorithm: the “total RNA ratio” (i.e. the fraction of the area in the region of 18S and 28S compared to the total area under the curve), 28S-region height, 28S area ratio and the 18S:28S ratio24. To a large extent, RIN score was a measure of ribosome RNA integrity. However, in most RNA-seq experiments, ribosome RNAs were depleted from the library to enrich mRNA through either ribo-minus or polyA selection procedure.
RIN only measures the overall RNA quality of an RNA sample. However, in real situation, the degradation rate may differs significantly among transcripts, depending on factors such as “AU-rich sequence”, “transcript length”, “GC content”, “secondary structure” and the “RNA-protein complex”. Therefore, RIN is practically not very useful in downstream analysis such as adjusting the gene expression count.
RIN has very limited sensitivity to measure substantially degraded RNA samples such as preserved clinical tissues. (ref: http://www.illumina.com/documents/products/technotes/technote-truseq-rna-access.pdf).
To overcome these limitations, we developed TIN, an algorithm that is able to measure RNA integrity at transcript level. TIN calculates a score (0 <= TIN <= 100) for each expressed transcript, however, the medTIN (i.e. meidan TIN score across all the transcripts) can also be used to measure the RNA integrity at sample level. Below plots demonstrated TIN is a useful metric to measure RNA integrity in both transcriptome-wise and transcript-wise, as demonstrated by the high concordance with both RIN and RNA fragment size (estimated from RNA-seq read pairs).
- Options:
- --version
show program’s version number and exit
- -h, --help
show this help message and exit
- -i INPUT_FILES, --input=INPUT_FILES
Input BAM file(s). “-i” takes these input: 1) a single BAM file. 2) “,” separated BAM files (no spaces allowed). 3) directory containing one or more bam files. 4) plain text file containing the path of one or more bam file (Each row is a BAM file path). All BAM files should be sorted and indexed using samtools. [required]
- -r REF_GENE_MODEL, --refgene=REF_GENE_MODEL
Reference gene model in BED format. Must be strandard 12-column BED file. [required]
- -c MINIMUM_COVERAGE, --minCov=MINIMUM_COVERAGE
Minimum number of read mapped to a transcript. default=10
- -n SAMPLE_SIZE, --sample-size=SAMPLE_SIZE
Number of equal-spaced nucleotide positions picked from mRNA. Note: if this number is larger than the length of mRNA (L), it will be halved until it’s smaller than L. default=100
- -s, --subtract-background
Subtract background noise (estimated from intronic reads). Only use this option if there are substantial intronic reads.
Output example:
geneID  chrom   tx_start        tx_end  TIN
ABCC2   chr10   101542354       101611949       67.6446525761
IPMK    chr10   59951277        60027694        86.383618429
RUFY2   chr10   70100863        70167051        43.8967503948
LICENSE
RSeQC is distributed under GNU General Public License (GPLv3)
This program is free software; you can redistribute it and/or modify it under the terms of the GNU General Public License as published by the Free Software Foundation; either version 3 of the License, or (at your option) any later version. This program is distributed in the hope that it will be useful, but WITHOUT ANY WARRANTY; without even the implied warranty of MERCHANTABILITY or FITNESS FOR A PARTICULAR PURPOSE. See the GNU General Public License for more details. You should have received a copy of the GNU General Public License along with this program; if not, write to the Free Software Foundation, Inc., 51 Franklin Street, Fifth Floor, Boston, MA 02110-1301 USA
Contact
Liguo Wang: wangliguo78@gmail.com
Shengqin Wang: wzsqwang@gmail.com
Wei Li: superliwei@gmail.com
Reference
Wang, L., Wang, S., & Li, W. (2012). RSeQC: quality control of RNA-seq experiments. Bioinformatics (Oxford, England), 28(16), 2184–2185. http://doi.org/10.1093/bioinformatics/bts356
Wang, L., Nie, J., Sicotte, H., Li, Y., Eckel-Passow, J. E., Dasari, S., et al. (2016). Measure transcript integrity using RNA-seq data. BMC Bioinformatics, 17(1), 1–16. http://doi.org/10.1186/s12859-016-0922-z